ETH/BTC Chart as an Altcoin Season Indicator

Key Insights
- Ethereum, as the largest altcoin, serves as a key index for altcoin season due to its central role in the altcoin market, particularly through its ETH/BTC pair, which reflects shifting investor sentiment toward riskier assets and the broader altcoin ecosystem.
- Thanks to Ethereum's high liquidity, dominant market capitalization, and integral role in DeFi and NFTs, the ETH/BTC chart effectively signals capital reallocation between Bitcoin and altcoins, while rising ETH/BTC ratios often indicate investor confidence in altcoins, potentially signaling the start of an altcoin season.
- Reliability of ETH/BTC chart as an altcoin season indicator can be influenced by Ethereum's ecosystem performance and growing competition from alternative blockchains. External factors like macroeconomic conditions, regulatory updates, and market manipulation during low liquidity periods also highlight the need to supplement ETH/BTC chart analysis with additional metrics for a holistic market view.
Altcoin season is a market phenomenon when altcoins demonstrate high returns compared to Bitcoin. The ETH/BTC chart is a key tool for analyzing this process, as Ethereum occupies a dominant position among altcoins and serves as a kind of barometer of investors' interest in the altcoin market. To understand why the ETH/BTC chart is so important, we need to consider its role, mechanisms, and limitations in detail.
What Is Altcoin
Altcoins, a term derived from alternative coins, encompass all cryptocurrencies other than Bitcoin. They are referred to as such because they provide alternatives to Bitcoin as well as traditional fiat currencies. Since the appearance of the first altcoins in 2011, thousands have been developed, each featuring distinct characteristics and functionalities.
Initially, many altcoins were created to address Bitcoin's limitations, such as by improving transaction speed or reducing energy consumption. In contrast, more recent altcoins are designed to fulfill diverse purposes depending on their developers' specific objectives.
Altcoins can be divided into several categories, such as stablecoins, mining-based coins, staking-based coins, and governance tokens. The classification of an altcoin typically depends on its operational mechanics and the goals it aims to achieve.
Despite their variety, many altcoins share a similar role with Bitcoin: functioning as decentralized, peer-to-peer payment systems and serving as a store of value.
However, some altcoins stand out by focusing on features like faster transaction processing or enhanced privacy. Others are engineered for particular use cases, often diverging significantly from Bitcoin’s original intent as a payments network.
What Is Altcoin Season
Altcoin season, often referred to as alt season, is a phase in the cryptocurrency market where Bitcoin's market dominance wanes as more investments flow into altcoins. Bitcoin dominance represents the percentage of Bitcoin's market capitalization compared to the total market cap of all cryptocurrencies.
An alt season typically begins when altcoins attract a larger portion of investments in comparison to Bitcoin.
In many cases, a sharp rise in Bitcoin's price is followed by similar increases in altcoin prices, which can decrease Bitcoin dominance in the market. Alternatively, the rise of innovative crypto projects or the influence of prominent figures in the industry can spark an alt season, prompting investors to explore options beyond Bitcoin.
Altcoin season is marked by altcoins consistently outperforming Bitcoin, which leads to a noticeable decline in Bitcoin dominance ratio. This trend is often fueled by emerging developments or new market opportunities within the crypto space, which inspire the creation of various new projects.
ETH/BTC Chart As the Main Indicator of Altcoin Season
The ETH/BTC chart is central to cryptocurrency market analysis due to Ethereum's unique role as a leading altcoin and foundational ecosystem.
Let's take a closer look at the key reasons why:
Capitalization and liquidity
Ethereum is the second largest asset on the cryptocurrency market, after Bitcoin. Its high market capitalization and liquidity create conditions for using ETH as a representative indicator for altcoins.
The ETH/BTC pair has one of the highest liquidity among cryptocurrency pairs. This allows it to respond quickly to changes in investor sentiment and capital reallocation between Bitcoin and altcoins.
If large institutional and retail investors begin to build up positions in ETH, this is reflected in the growth of the ETH/BTC pair.
The growth of ETH/BTC may be a signal that investors are willing to take higher risks, which is typical of altcoin growth phases.
ETH's large capitalization ($393.68B) makes it relatively resilient to volatility compared to smaller altcoins. This allows ETH to be used as a first mover to analyze interest in the altcoin market as a whole.
Market psychology
Investors who are willing to move from Bitcoin to ETH often see it as a first step before further investments in riskier altcoins. Thus, ETH/BTC becomes a leading indicator of capital reallocation.
Proof-of-Stake
Ethereum's transition to Proof-of-Stake in 2022 was an important development that increased the attractiveness of ETH as an asset. Investors began to perceive Ethereum as a more energy-efficient and resilient platform compared to Bitcoin, which contributed to the growing interest in ETH and other altcoins.
DeFi and NFT support
Ethereum is the backbone for most dApps and NFT trading platforms. The popularity of these segments is directly related to the price performance of ETH. For example:
The growth of DeFi projects leads to an increase in demand for ETH, which is reflected in the ETH/BTC chart.
Activity in the NFT sector also strengthens the position of ETH as a key asset.
Insentive for innovation in altcoins
Ethereum's success motivates other blockchains such as Solana, Polkadot, and Avalanche to develop their technologies. This creates an overall positive sentiment in the altcoin market, making ETH/BTC an indicator of broad momentum.
ETH/BTC Chart Close connection with other altcoins
Ethereum plays the role of the center of gravity for the altcoin market. Its dynamics influence many other cryptocurrencies.
Correlation with major altcoins
The rise of ETH/BTC has historically been accompanied by a rise in the prices of assets such as the following.
Often rises following ETH as the Binance Smart Chain closely competes with Ethereum for DeFi.
ADA (Cardano)
Actively competes with Ethereum as a platform for smart contracts. Growing interest in ETH may also fuel demandfor ADA.
SOL (Solana)
Positioned as an “Ethereum killer” but often follows its price trends.
Impact on low-capitalization altcoins
When ETH/BTC shows strong growth, investors begin to show interest in lesser-known altcoins, hoping for their potentially higher returns.
Driver function
Ethereum often acts as a catalyst for the start of the altcoin season. Investors first invest in ETH as a more reliable asset, and then, seeing its growth, reallocate capital to other altcoins.
Metrics and Analysis of the ETH/BTC Chart
The ETH/BTC chart can be viewed through several analytical approaches, as outlined below.
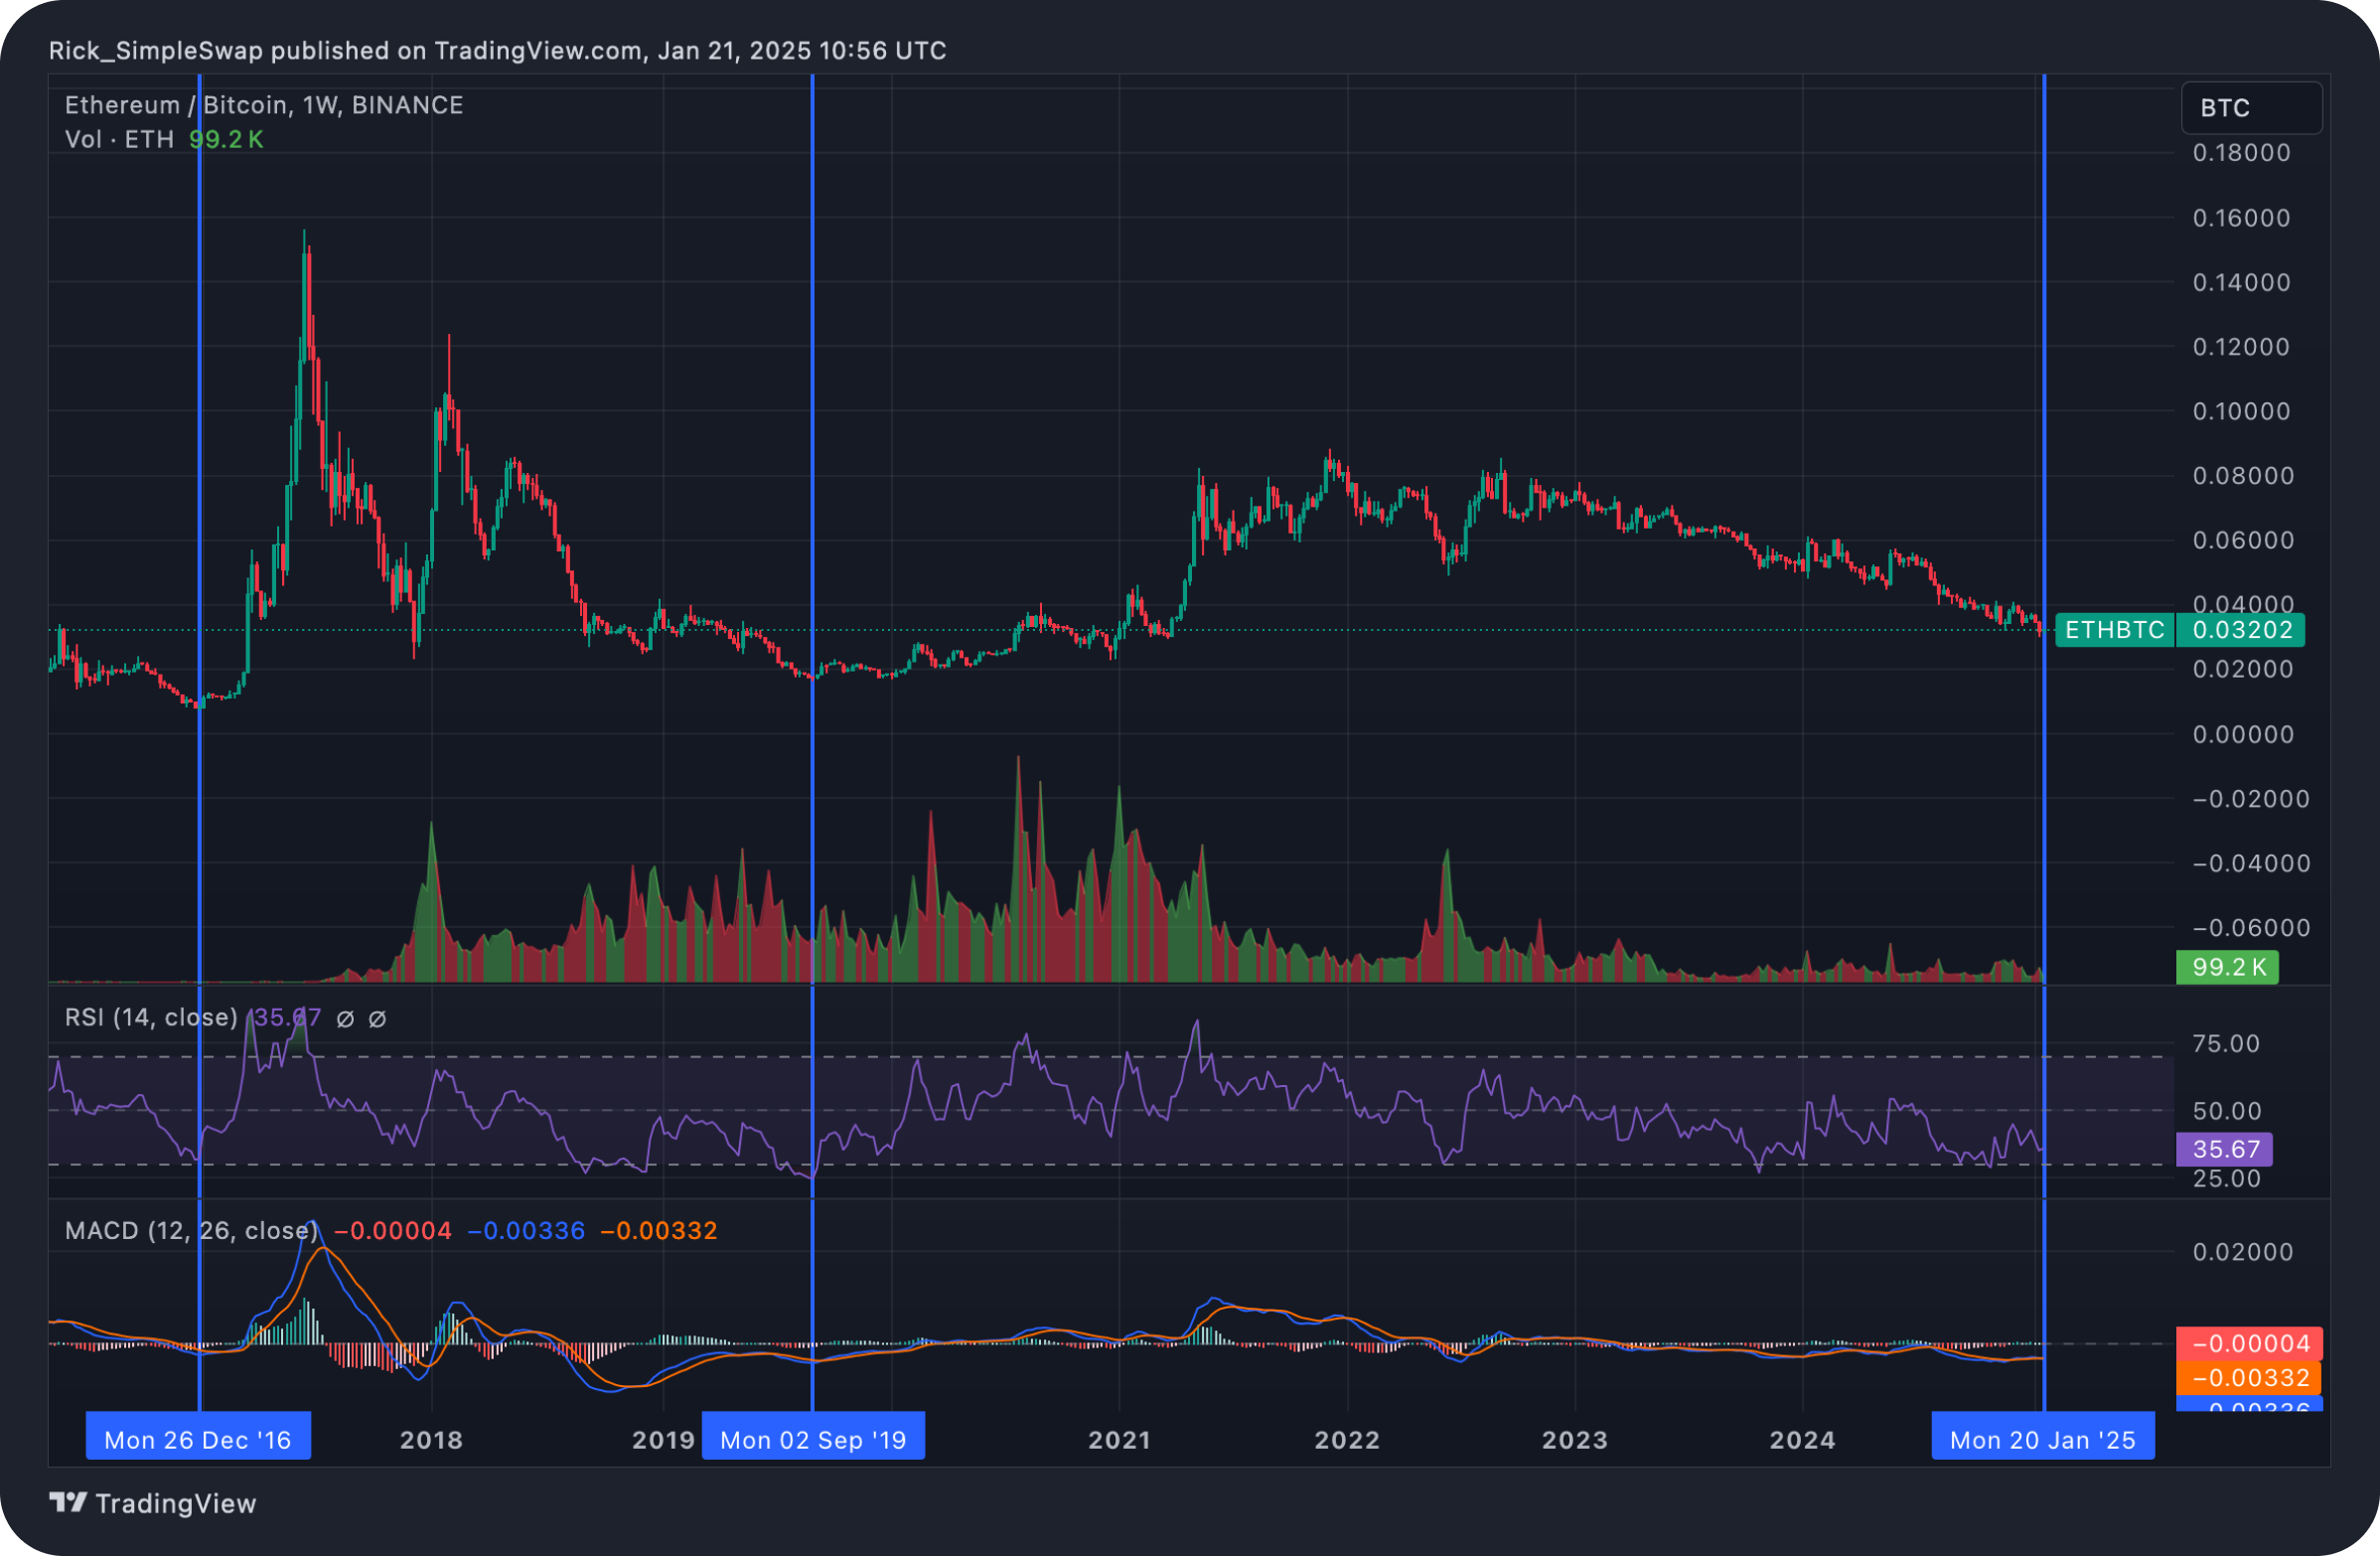
Trends and cycles
Historical data shows that ETH/BTC goes through up and down phases, which often coincide with changes in Bitcoin dominance and overall market sentiment.
Rising ETH/BTC
Signals the start of the alt season as investors seek riskier assets with high potential returns.
Decline in ETH/BTC
Indicates a growing interest in Bitcoin as a safe-haven asset in an uncertain environment.
Technical analysis
Technical indicators on the ETH/BTC chart may provide additional signals:
RSI and MACD indicators
If the RSI (Relative Strength Index) for ETH/BTC exceeds 70, it may indicate that ETH is overbought relative to BTC and a correction is likely.
Breakout of resistance levels
If the ETH/BTC pair breaks a key resistance level, it is often the beginning of a strong upward trend.
Key support and resistance zones
Support zones
If ETH/BTC tests key support levels and holds, it could indicate the beginning of capital accumulation in altcoins.
Resistance zones
A break of strong resistance usually confirms the onset of the altcoin season.
Additional Metrics of the ETH/BTC Chart Analysis
Bitcoin dominance
BTC dominance is the share of Bitcoin in the total market capitalization of cryptocurrencies.
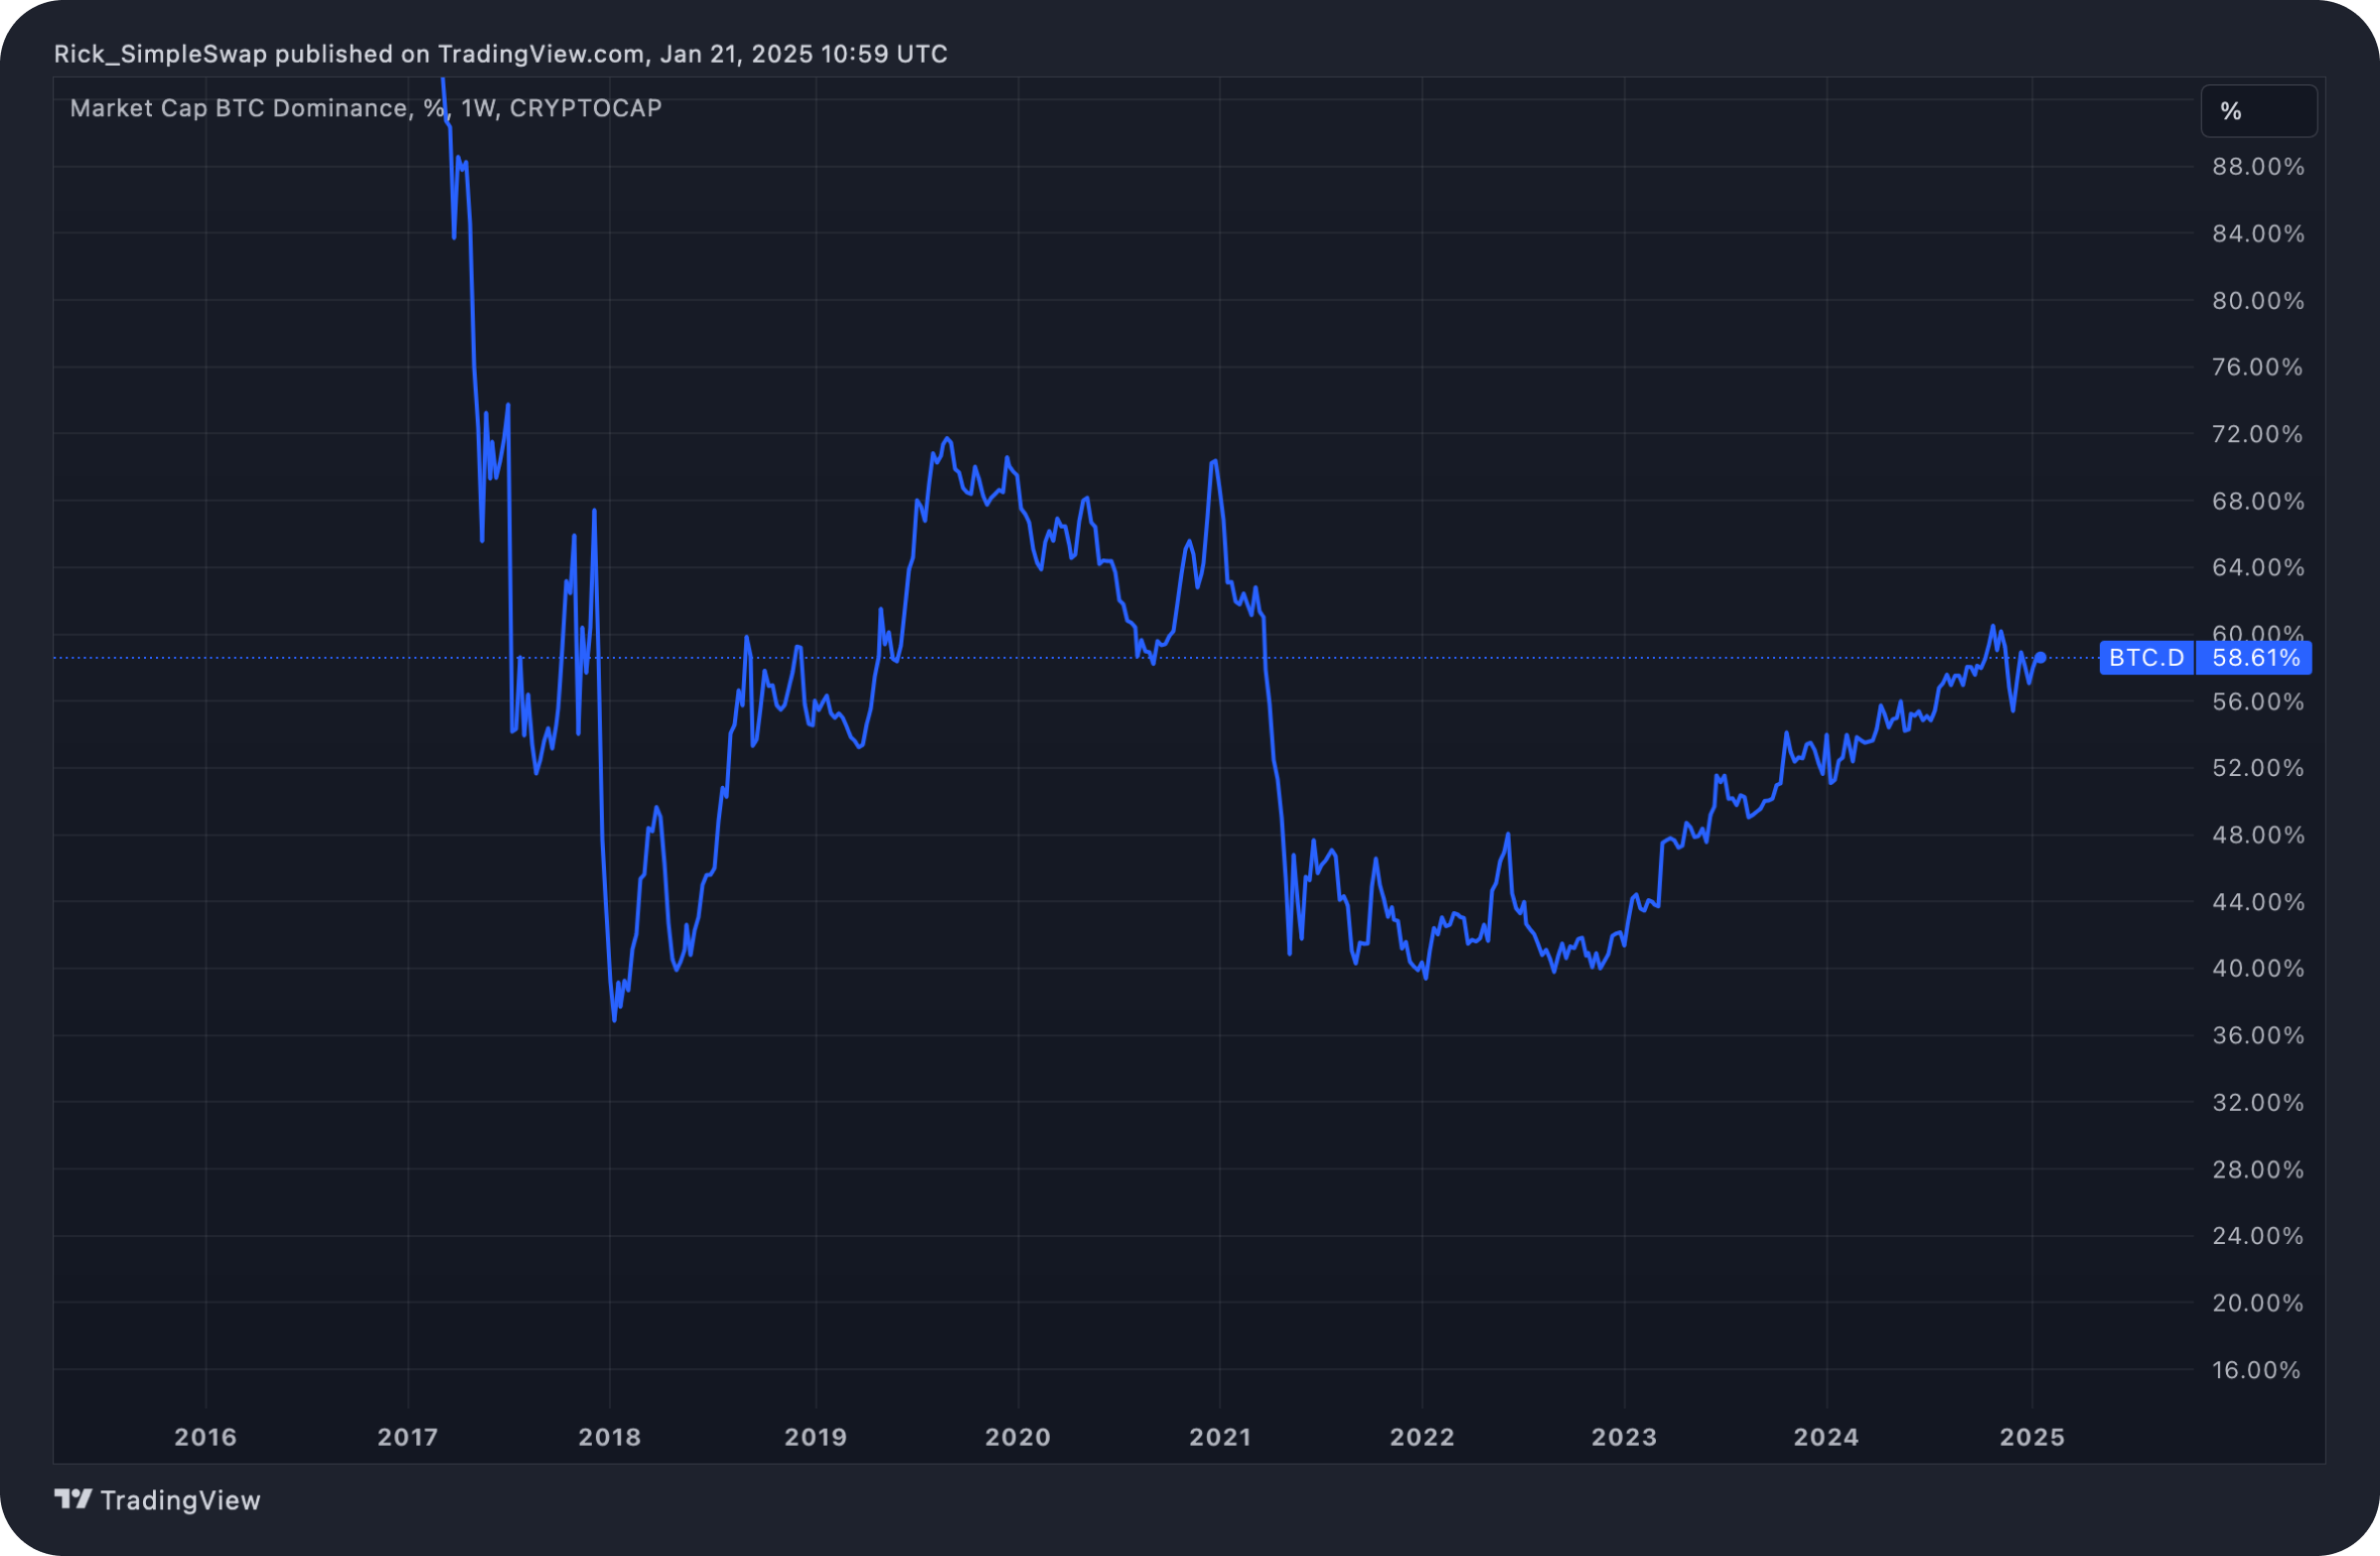
f BTC dominance decreases, it confirms the reallocation of capital in favor of altcoins.
A rise in ETH/BTC combined with a decrease in BTC dominance is often a strong signal of the altcoin season.
Trading volumes
Trading volumes on ETH/BTC pair show the level of investors' interest. High volumes with the growth of ETH/BTC strengthen the signal about the coming of the alt season.
Macroeconomic factors
The cryptocurrency market is closely linked to global macroeconomic conditions:
Liquidity phase
If central banks stimulate the economy, investors are more likely to seek riskier assets, including altcoins.
Regulatory changes
Positive news about cryptocurrencies may accelerate the growth of ETH/BTC.
Historical Examples of ETH/BTC Chart as an Altcoin Indicator
2017
During the previous bull run, the ETH/BTC pair saw strong growth, coinciding with a surge in interest in altcoins including XRP, ADA, and others.
2020-2021
The period following Bitcoin halving in 2020 was marked by the rise of ETH/BTC, marking the beginning of a massive altcoin rally. This was especially notable in the context of the explosive growth of DeFi and NFT.
Limitations of the ETH/BTC Chart
Despite its usefulness, ETH/BTC has its limitations:
Dependence on the Ethereum ecosystem
If there are glitches on Ethereum or competitors offer better solutions, the ETH/BTC pair may lose relevance as an indicator.
Alternative altcoins
Ethereum's dominance among altcoins is gradually declining, which may reduce its correlation with the rest of the market.
Market manipulation
During periods of low liquidity, the ETH/BTC chart can be subject to manipulation, especially by large participants.
We’d like to remind you that you can get any cryptocurrency for fiat or crypto on SimpleSwap.
Summary
The ETH/BTC chart is a powerful analytical tool for assessing the likelihood of an alt season. Its use in combination with other metrics such as BTC dominance, trading volumes, and macroeconomic indicators allows for more accurate forecasting of market cycles.
However, it is important to remember that the ETH/BTC chart is only one piece of the puzzle, and a wide range of factors, including fundamental and technical aspects of the market, must be taken into account for a complete analysis.
The information in this article is not a piece of financial advice or any other advice of any kind. The reader should be aware of the risks involved in trading cryptocurrencies and make their own informed decisions. SimpleSwap is not responsible for any losses incurred due to such risks. For details, please see our Terms of Service.


