Bitcoin On-chain Review November 2023

Key Insights
- BTC analysis shows that increased trading volumes and larger average transaction sizes in November indicate heightened interest and more active trading of the cryptocurrency.
- Bitcoin technical analysis using indicators like the Bitcoin Rainbow Price Chart suggests the asset remains undervalued, signalling potential for further price appreciation.
- On-chain analysis reveals stable levels of new Bitcoin addresses and network activity during November, reflecting sustained adoption and growth in the use of the asset.
On-chain data and Bitcoin technical analysis can provide traders valuable insights into usage trends and the current Bitcoin price today.
For investors and traders on-chain data unveils crucial information about who holds or trades specific cryptocurrencies, how sophisticated investors are managing their portfolios, and the reactions of token holders to market events.
Utilizing on-chain analysis involves extrapolating trends and assessing crypto market sentiment.
Combined analysis of on-chain data indicators and technical patterns can help expand traders' understanding of where the BTC value might be heading.
For the first time we use Fear and Greed Index as metrics.
Bitcoin exchange rate in November 2023 showed significant fluctuations reflected in the main indicators.
- Closing Price
At the end of November, the closing price of BTC was $37,708.19. This indicator reflects the last price of the asset in the market during that month.

- High/Low Price
High price for November: During the month, BTC reached its highest value, which was $38,459.70. This peak represents the maximum value that buyers were willing to pay for Bitcoin during the month. When analysing Bitcoin transactions, we can see how they influence to the highs and lows.
Low price for November: At the same time, the minimum price of Bitcoin in November reached $34,083.45. This level represents the lowest value of BTC recorded during the month, which can be an interesting aspect to analyse trends and market dynamics.
BTC Trading Volume
In November, there was a high level of activity in BTC trading, expressed in significant volumes of transactions.

The volume of BTC trades reached impressive maximum values of $38.75 billion. This figure represents the total volume of all transactions made on the crypto market during the month. Based on the Bitcoin analysis, it can be concluded that the high level of trading volume may reflect the interest and activity of market participants in BTC.
The increased transaction volume could lead to a potential increase in the Bitcoin to USD price if the increased activity continues. Analysts will be monitoring the BTC to USD exchange rate in December to see if the high volumes in November translate to sustained demand.
Bitcoin Rainbow Chart Indicator
Despite the asset’s steady growth since the beginning of 2023 and its pursuit of price levels around $40,000, BTC analysis using in the Bitcoin Rainbow Price Chart indicator shows a continued state of undervaluation of the cryptocurrency.
Bitcoin Rainbow Chart provides a comprehensive assessment of the current value of BTC considering different time frames and shows that despite the levels reached, the market price remains below expectations.

This undervaluation can keep investors optimistic, indicating potential opportunities for further growth in the price of Bitcoin.
Indicators such as the Bitcoin Rainbow Chart provide valuable information for traders, helping them make informed decisions based on comprehensive crypto market research and on-chain analysis.
Average BTC Transaction Size
During the first days of November, the Average Transaction Size in the Bitcoin network was $28,451. However, by the end of the month, this figure increased significantly and reached $92,536. This indicates a noticeable change in the volume of the asset.
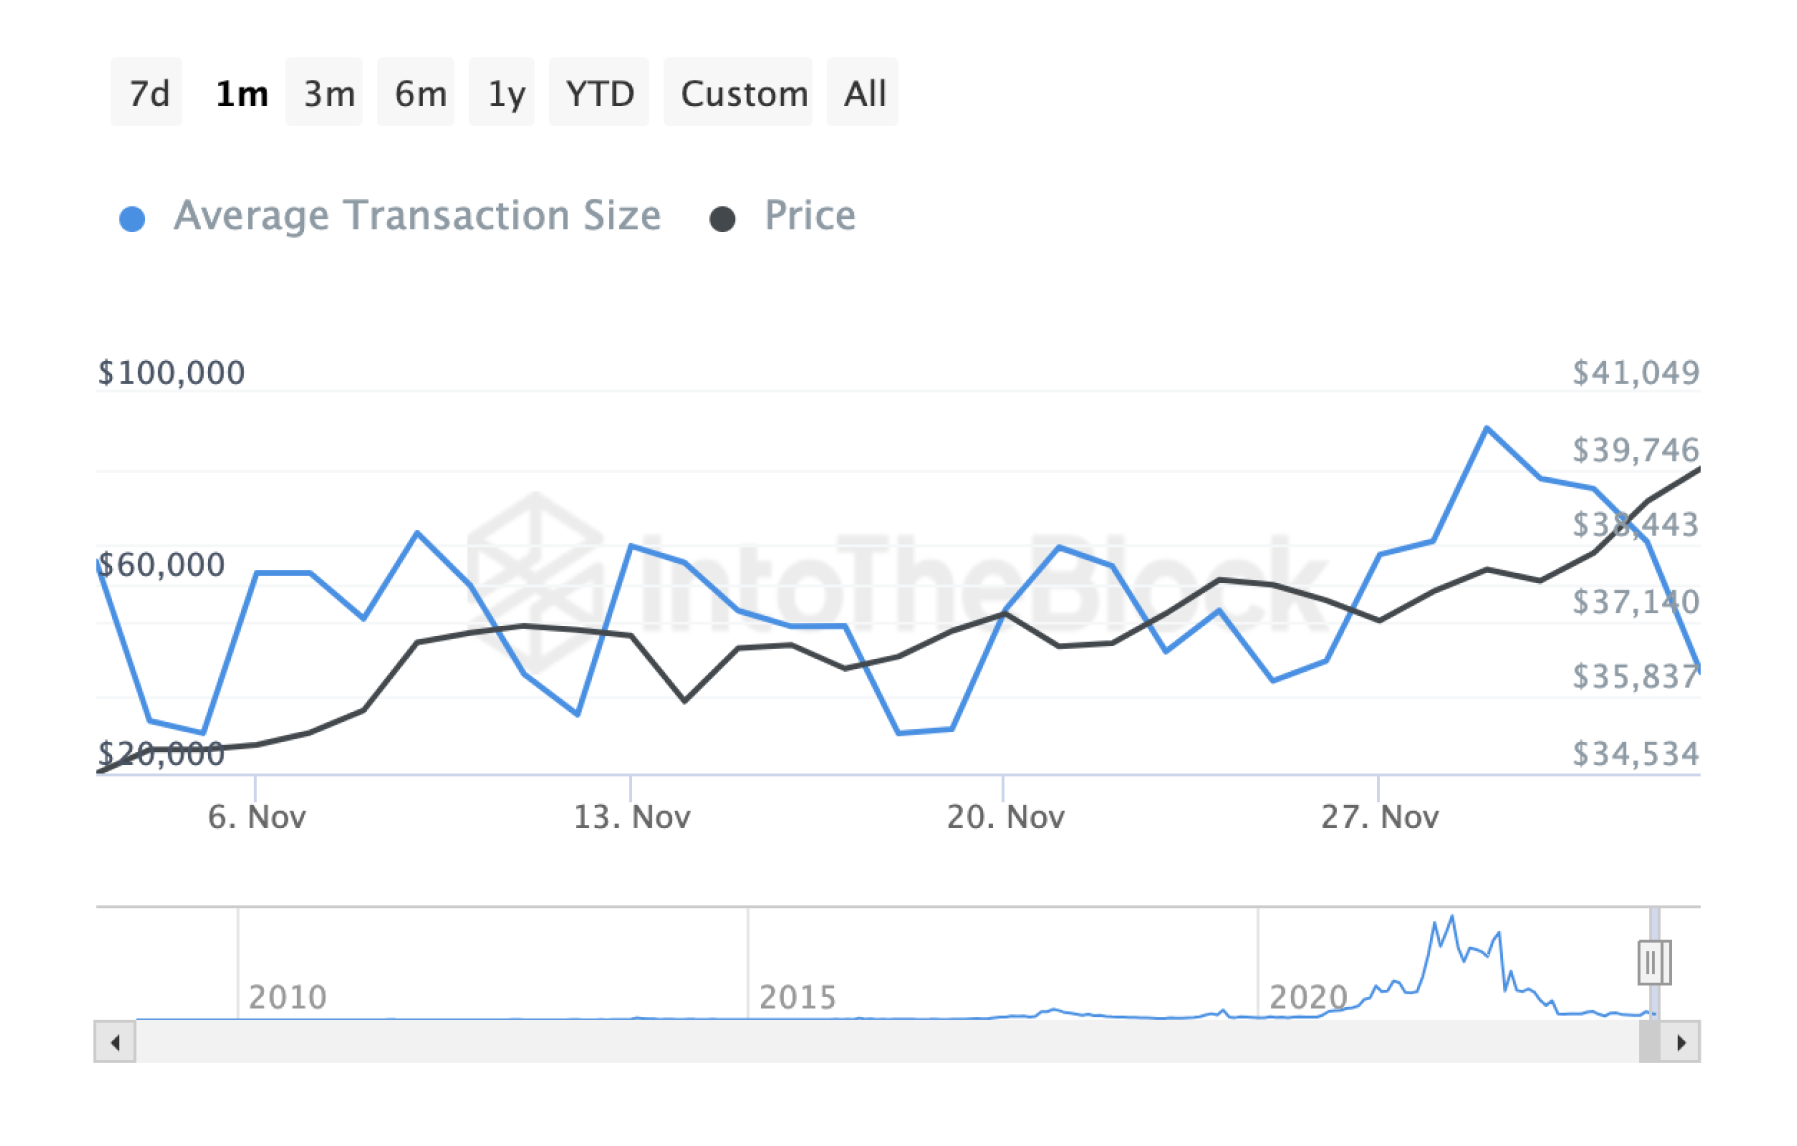
An increase in the average Bitcoin transactions size may indicate heightened trader interest in larger transactions. Such dynamics may reflect general trends in the use of BTC as a means of preserving and transferring value.
You can also use the Unspent Transaction Outputs (UTXO) metric to analyse transactions, which provides information on the time elapsed since the last transaction by unspent transaction outputs on the Bitcoin network.
Number of New BTC Addresses
During the month, the number of new addresses remained in a relatively stable range, fluctuating between 400,000 and 600,000 per day. This on-chain analysis indicator shows the continued interest of participants in creating new wallets and incorporating more participants.

The stable number of new addresses may indicate the growing popularity of Bitcoin and an increase in the number of users wanting to join the Bitcoin network.
It may also be related to the increasing interest of investors in Bitcoin transactions and the creation of new wallets for storing digital assets.
BTC Active Addresses Ratio
An Active Addresses Ratio of around 2% during the month indicates the level of address activity in the Bitcoin network relative to the total number of existing addresses.

This level of activity has been maintained for a month now and, according to BTC technical analysis, may indicate the stability of Bitcoin address usage.
BTC Hash Rate
The Bitcoin analysis Hash Rate indicator increased from 400 million terahash per second (400m Th/s) to 575 million terahash per second (575m Th/s) during the month.
This indicates a gradual growth in the overall processing power of miners on the Bitcoin network, which could be due to an uptick of interest in mining or hardware upgrades. An increase in Hash Rate may increase the security of the Bitcoin network.

On-Chain Analysis: Fear and Greed Index
The Fear and Greed Index measures stock market sentiment to determine if stocks are fairly priced. It operates on the premise that excessive fear drives prices down, while excessive greed drives them up.
Fear and Greed Index is composed of seven indicators: market momentum, stock price strength, stock price breadth, put and call options, junk bond demand, market volatility, and safe haven demand. Each indicator is equally weighted and the Fear and Greed index calculates a score from 0 to 100, with 100 indicating maximum greed and 0 indicating maximum fear.
The Fear and Greed Index updates with new data, helping investors gauge market sentiment and recognize their own emotional biases. When used alongside fundamental analysis and other tools, it provides a useful measure of crypto market mood.

Greedy state in Bitcoin technical analysis is often marked by high demand, and investors may exhibit more aggressive behavior to take advantage of profit opportunities.
However, a Greedy condition can also indicate an increased level of risk, as the market can become overheated and traders may experience a correction of the price of Bitcoin in the future.
Users can get BTC for fiat or crypto on SimpleSwap.
Summary
Overall, the Bitcoin on-chain analysis for November 2023 indicates high dynamism and interest from participants. Despite BTC price fluctuations, there is a certain undervaluation of the asset, which may attract investors, supporting an optimistic mood.
On-chain analysis showed that high trading volume and an increase in average transaction size indicate active trading and heightened interest in larger transactions. A stable number of new addresses and activity of existing addresses indicate the growing popularity of BTC and stable usage of the Bitcoin network.
An increase in Hash Rate indicates an increase in the processing power of miners, which strengthens the security of the Bitcoin network. However, the state of Greed (as per the Fear and Greed Index) among investors requires caution, as it may be accompanied by an increased risk of the Bitcoin price correction.
Bitcoin prediction models estimate the price may continue to consolidate in the near-term. Overall, the November 2023 BTC market showed signs of strong potential.
The information in this article is not a piece of financial advice or any other advice of any kind. The reader should be aware of the risks involved in trading cryptocurrencies and make their own informed decisions. SimpleSwap is not responsible for any losses incurred due to such risks. For details, please see our Terms of Service.


