MA100 & EMA Ribbon

Key Insights
- The MA100 quantifies market structure and period to make use of the dominant trend, while the dynamic EMA Ribbon reveals the shifts for entry.
- The system aims to capitalize on extended moves in the direction of the prevailing trend.
- Profit targets are set at previous hourly highs, closing partial positions at each target to systematically take profits.
In this article we outline a crypto strategy based on two major indicators: MA100 and EMA Ribbon.
What Is MA100
The 100-day moving average is a popular technical indicator among traders, used to analyze stock price trends over the medium term.
MA100 calculates the average price of a stock over 100 days, helping traders determine whether a stock is in an uptrend, downtrend, or moving sideways.
This moving average also provides buy and sell signals, offering insight into medium-term market sentiment.
A moving average in finance is a stock indicator commonly used in technical analysis to smooth out short-term price fluctuations and highlight longer-term trends.
By calculating the moving average, traders can reduce the impact of random, short-term variations in stock prices.
Moving average is a trend-following indicator, meaning it relies on past prices to identify the direction of a stock's trend or to determine its support and resistance levels.
The longer the period used for the moving average, the more significant the lag, making it a useful tool for understanding overall market sentiment and making informed trading decisions.
What Is EMA Ribbon
An exponential moving average (EMA) ribbon is a technical analysis tool featuring multiple moving averages of different lengths plotted on the same chart. Typically, users plot between 6 and 16 EMAs, although some may opt for simple moving average (SMA) instead.
The lengths of an exponential moving average can vary significantly, and choosing the appropriate lengths depends on the time horizon and investment objectives.
The EMA ribbon consists of several exponential moving averages displayed as lines of different colors, forming a ribbon-like pattern. This pattern offers valuable insights into the market's direction.
Unlike a simple moving average, which assigns equal weight to all data points, exponential moving average places greater emphasis on recent price data. This heightened sensitivity to recent price movements makes the EMA ribbon particularly effective for identifying short-term trends.
The EMA Ribbon Indicator, based on the concept of exponential moving averages, helps traders identify market direction and potential entry and exit points.
By analyzing the ribbon-like pattern created by multiple EMAs, traders can gain a clearer understanding of market trends and make more informed trading decisions.
MA100 and EMA Ribbon Settings
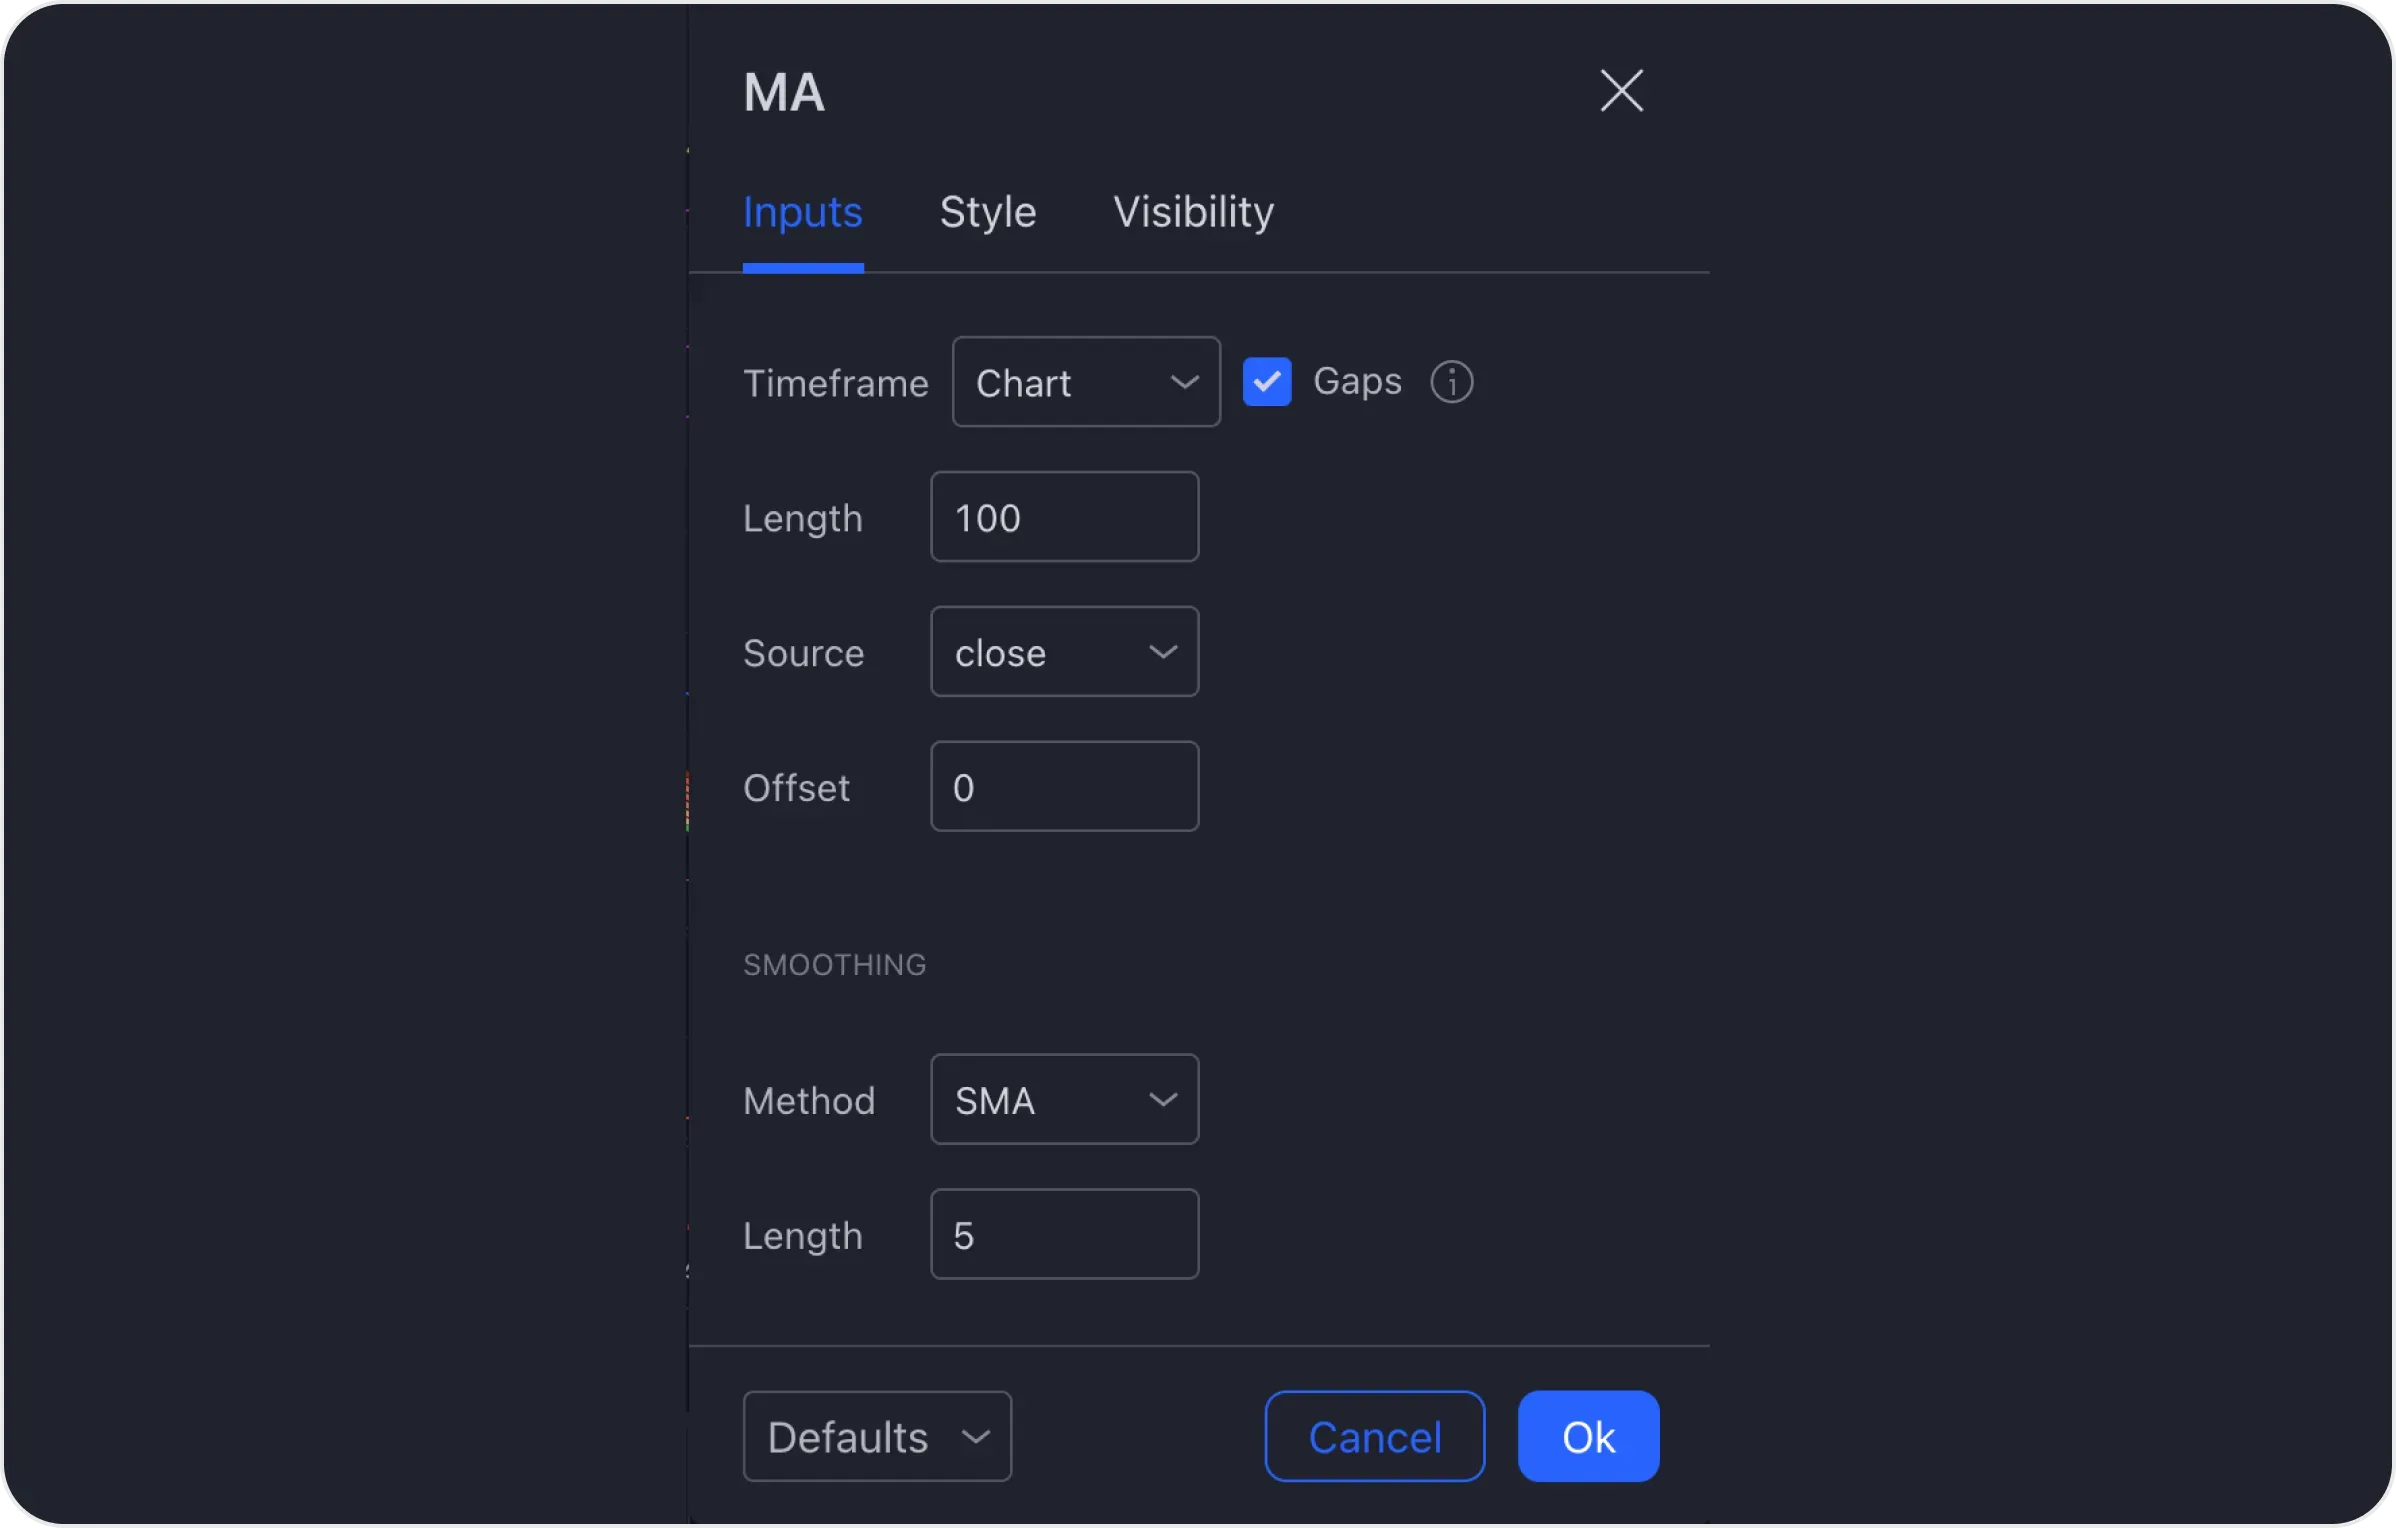
- MA100
Open the indicator settings and enter 100 in the Length line.
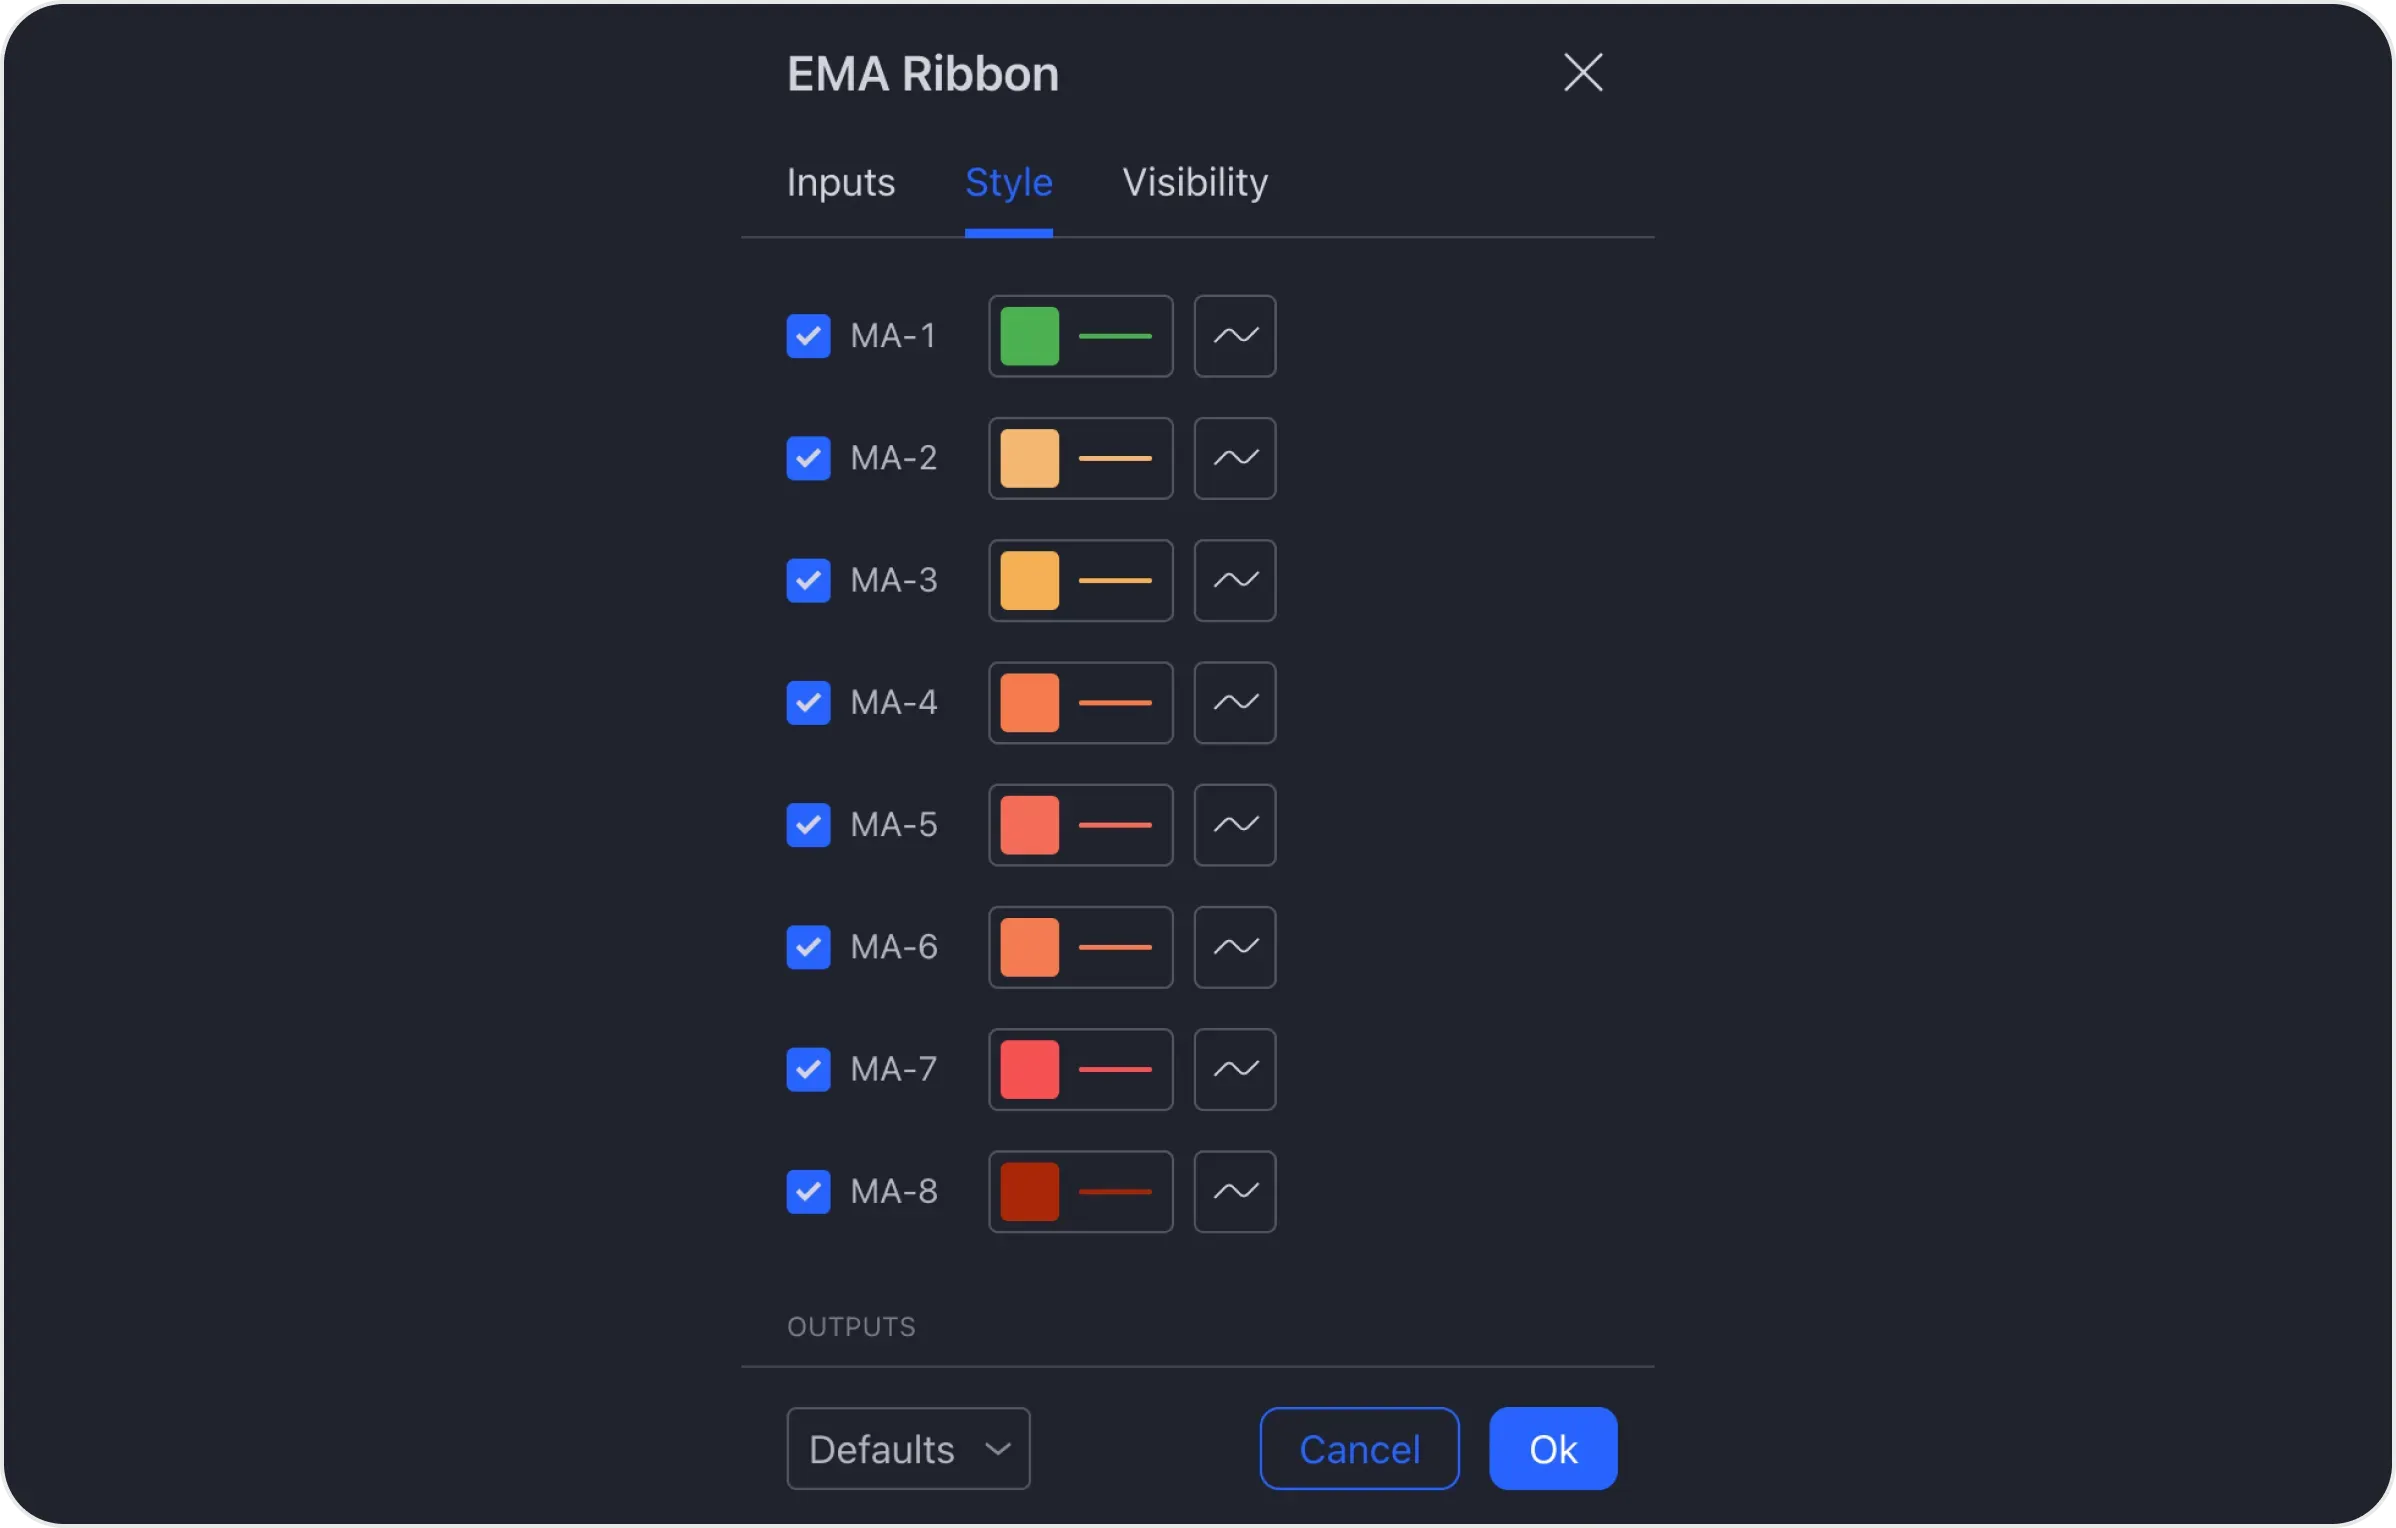
- EMA Ribbon
Open the indicator settings and change the MA-1 colour to green or whatever colour you like better. It is important to see it when studying the graph.
MA100 & EMA Ribbon: Indicators' Application
We follow the EMA Ribbon green line crossing the MA100 blue line. The price line on this crypto chart is above MA100, which is a local uptrend.
This condition is a signal for us to enter the deal.
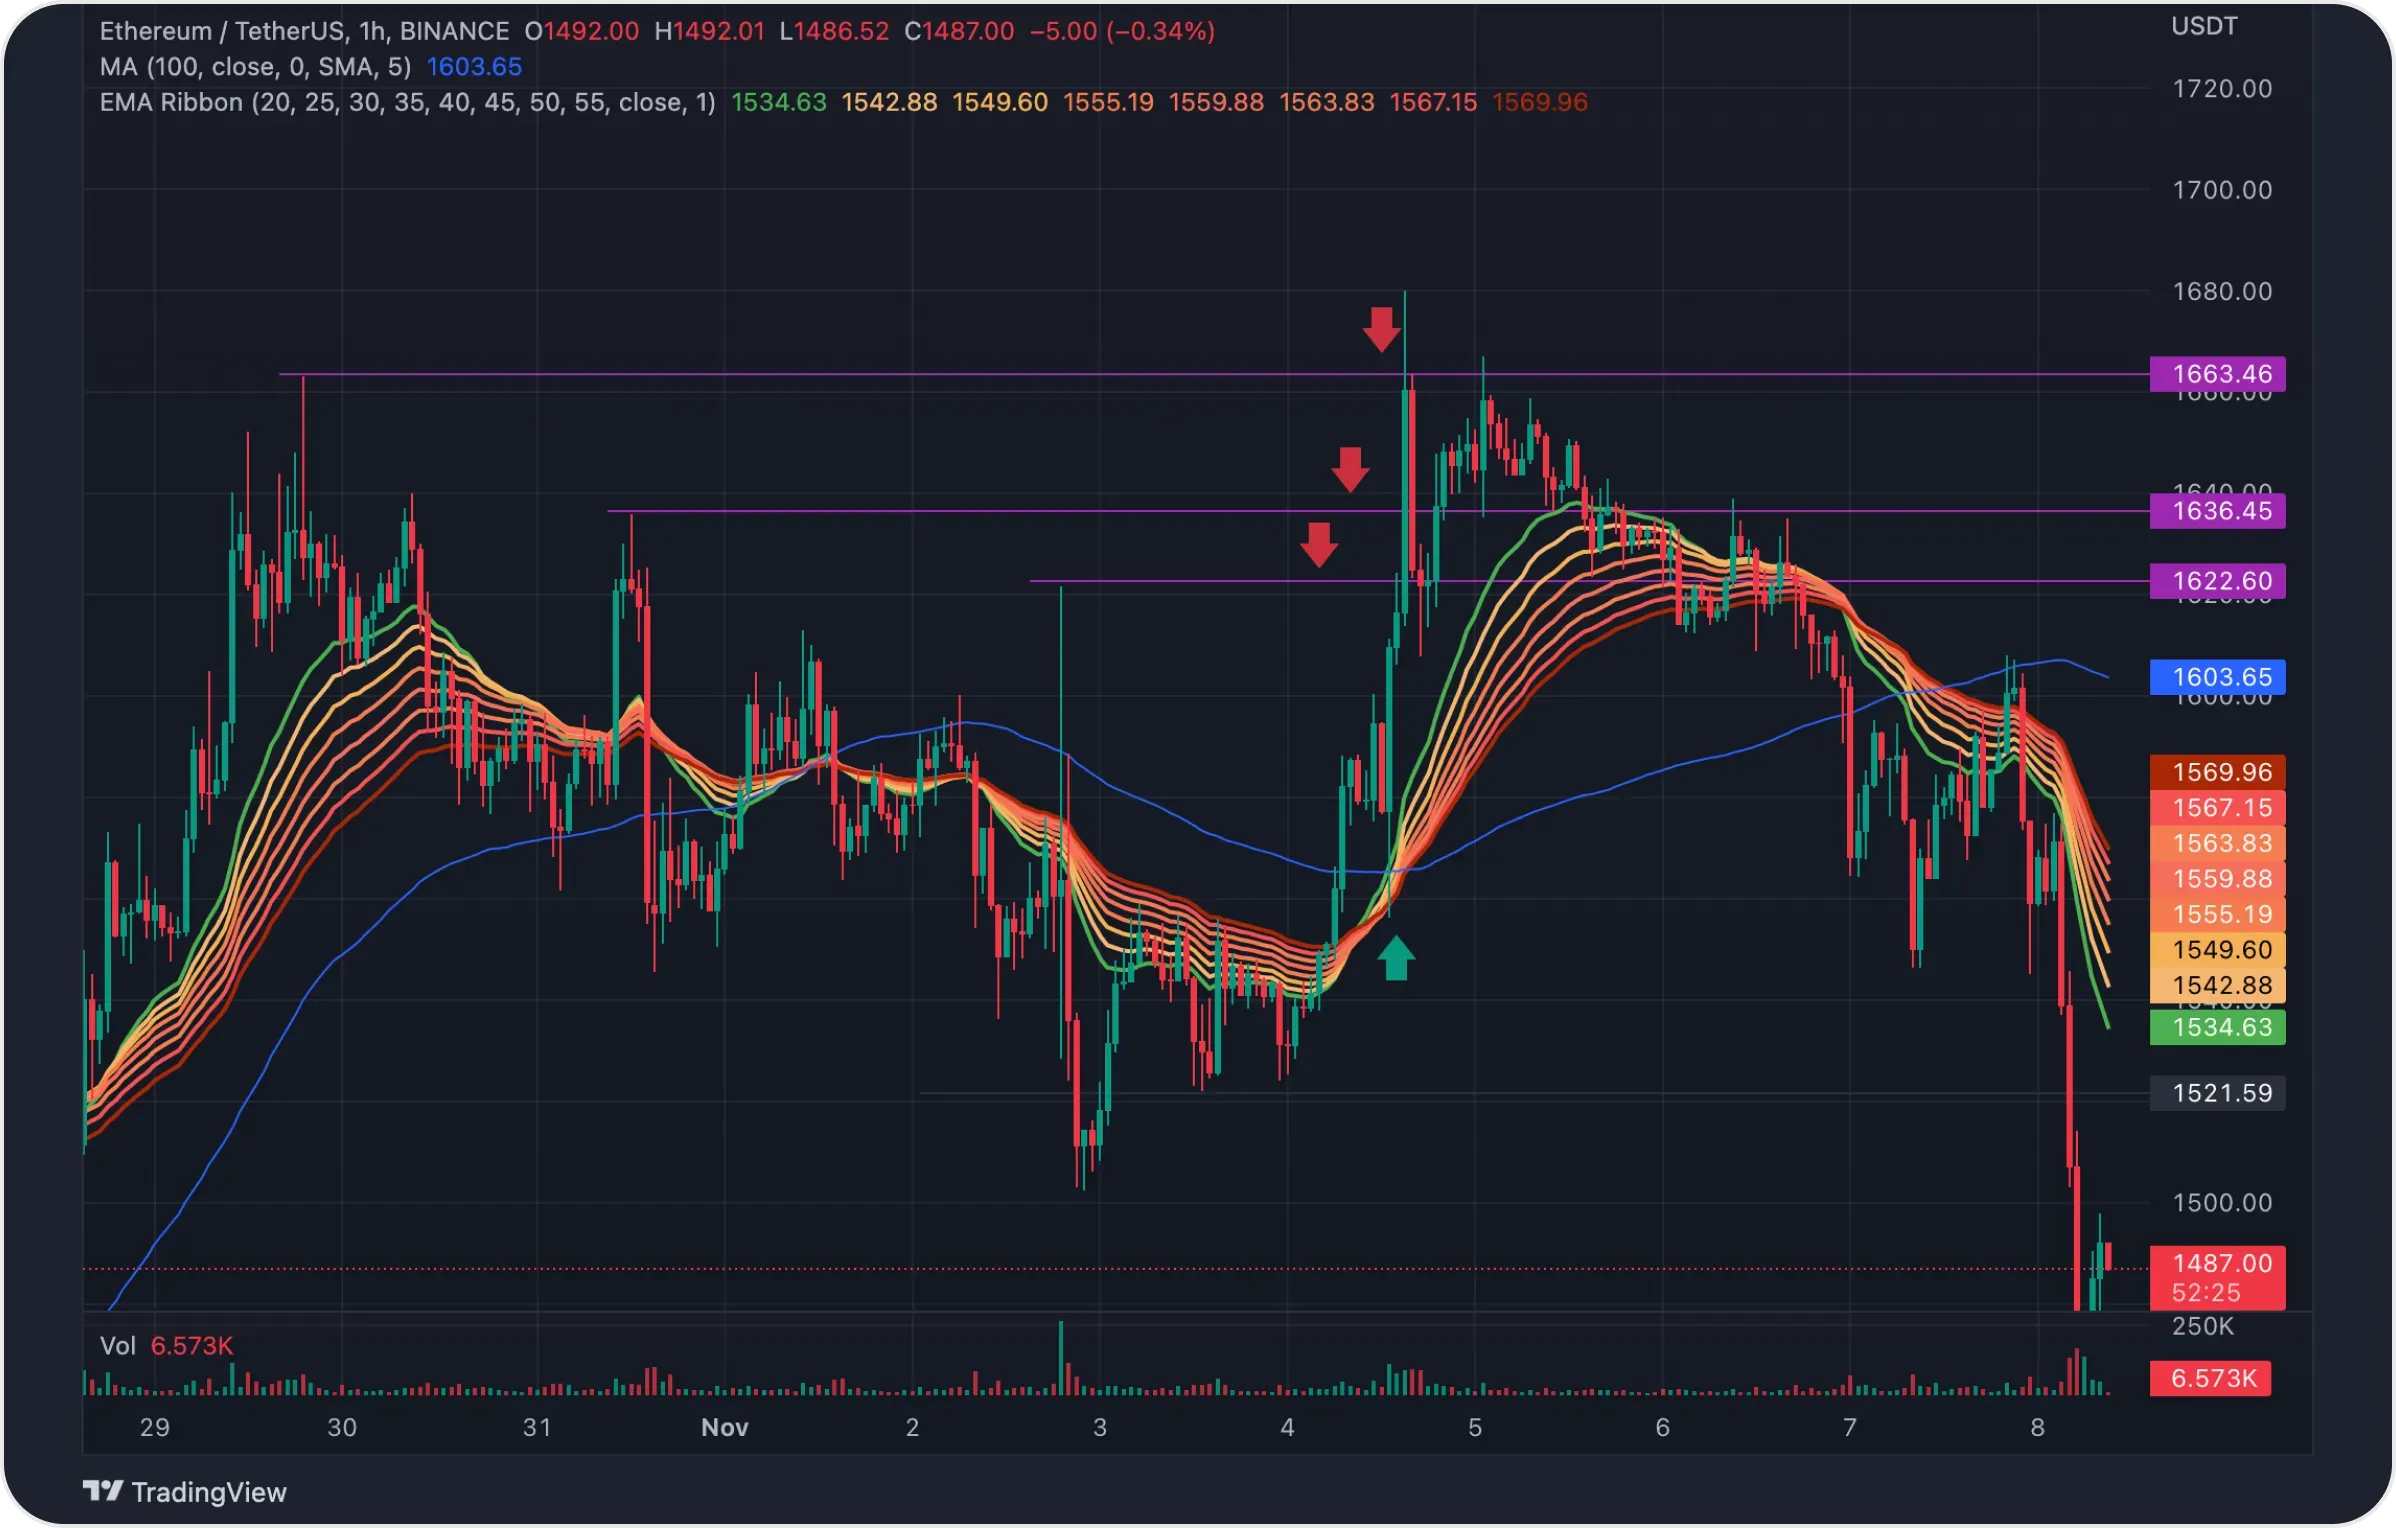
With the help of previous hourly price highs, we set our trade targets. In this case, we see 3 of them.
Upon reaching the first target, we close 50% of the position; upon reaching the second goal, we close 50% of the remaining position; on 3 targets we fix our positions by 100%.
Summary
In this strategy, we have worked with trading on the hourly timeframe using two indicators, MA100 and EMA Ribbon.
MA100 is used to determine the local trend, and the EMA Ribbon is used to determine the entry point into the deal, so we’ve reviewed the settings of both indicators and the conditions for doing or not doing so. Besides, we set profit and exit targets using previous hourly highs in price.
Users can purchase crypto assets of their choice for this strategy on SimpleSwap.
The information in this article is not a piece of financial advice or any other advice of any kind. The reader should be aware of the risks involved in trading cryptocurrencies and make their own informed decisions. SimpleSwap is not responsible for any losses incurred due to such risks. For details, please see our Terms of Service.


