GRT Technical Analysis

Key Insights
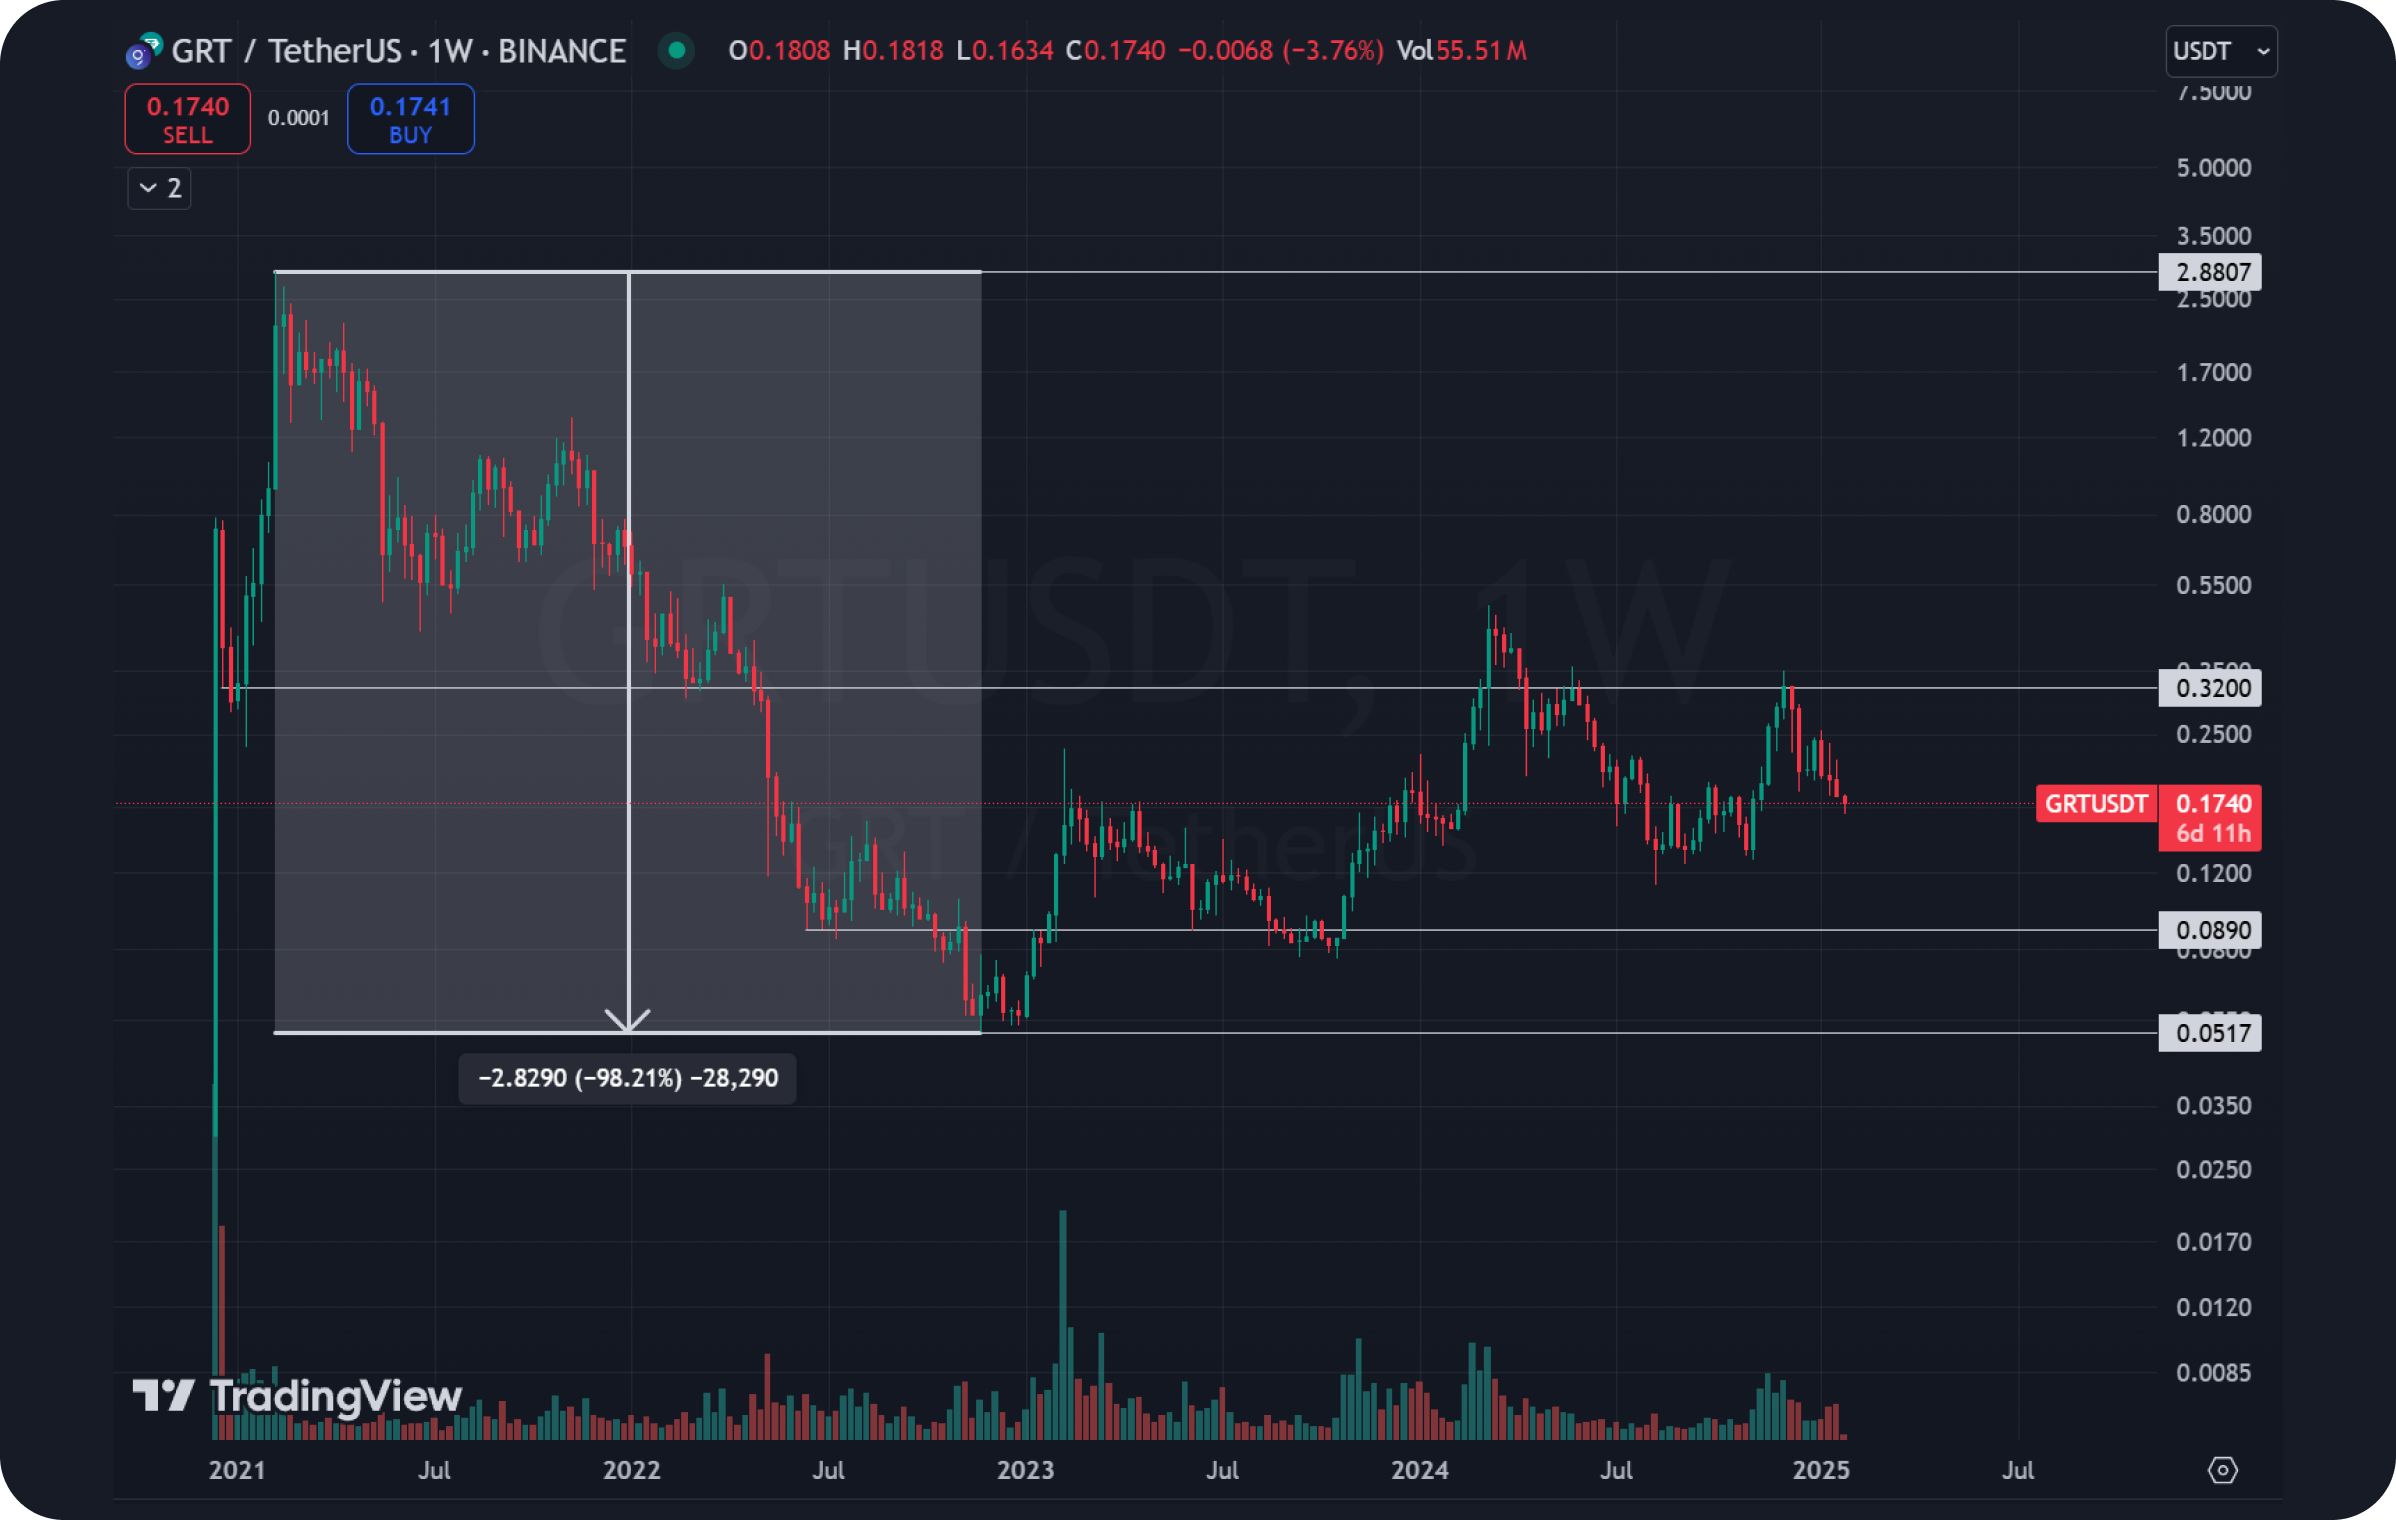
- GRT experienced rapid growth shortly after its launch in late 2020, reaching an all-time high of $2.88, but later dropped 98.21% to a historic low of $0.051 in November 2022.
- The asset is moving within an ascending channel, forming a bullish wedge near a key Point of Control (POC) support zone, which suggests increased buyer activity.
- Breaching the $0.32 resistance could lead to price targets of $0.48 and beyond, with potential for accelerated growth if the upper trendline is broken.
As of writing, The Graph (GRT) ranks 65th on the CoinMarketCap list with a market capitalization of $1.62 billion.
GRT Tech Analysis
GRT began trading in late 2020. Entering the market during a bull cycle, the asset quickly gained investors' attention. Following an initial correction, the price of the asset experienced a rapid increase. Within just a month, GRT surged more than 10x, rising from $0.23 to its all-time high (ATH) of $2.88.
However, the end of the bull cycle resulted in a significant price decline. Following the overall market dynamics, GRT dropped by 98.21% from its peak, reaching an all-time low (ATL) of $0.051 in November 2022. This level can be considered a local bottom from which the recovery phase began.
Key levels to watch include resistance at around $0.32, which previously served as a significant support level and was the starting point for the bull run in early 2021. This historical, mirrored level remains an essential reference point for further growth.
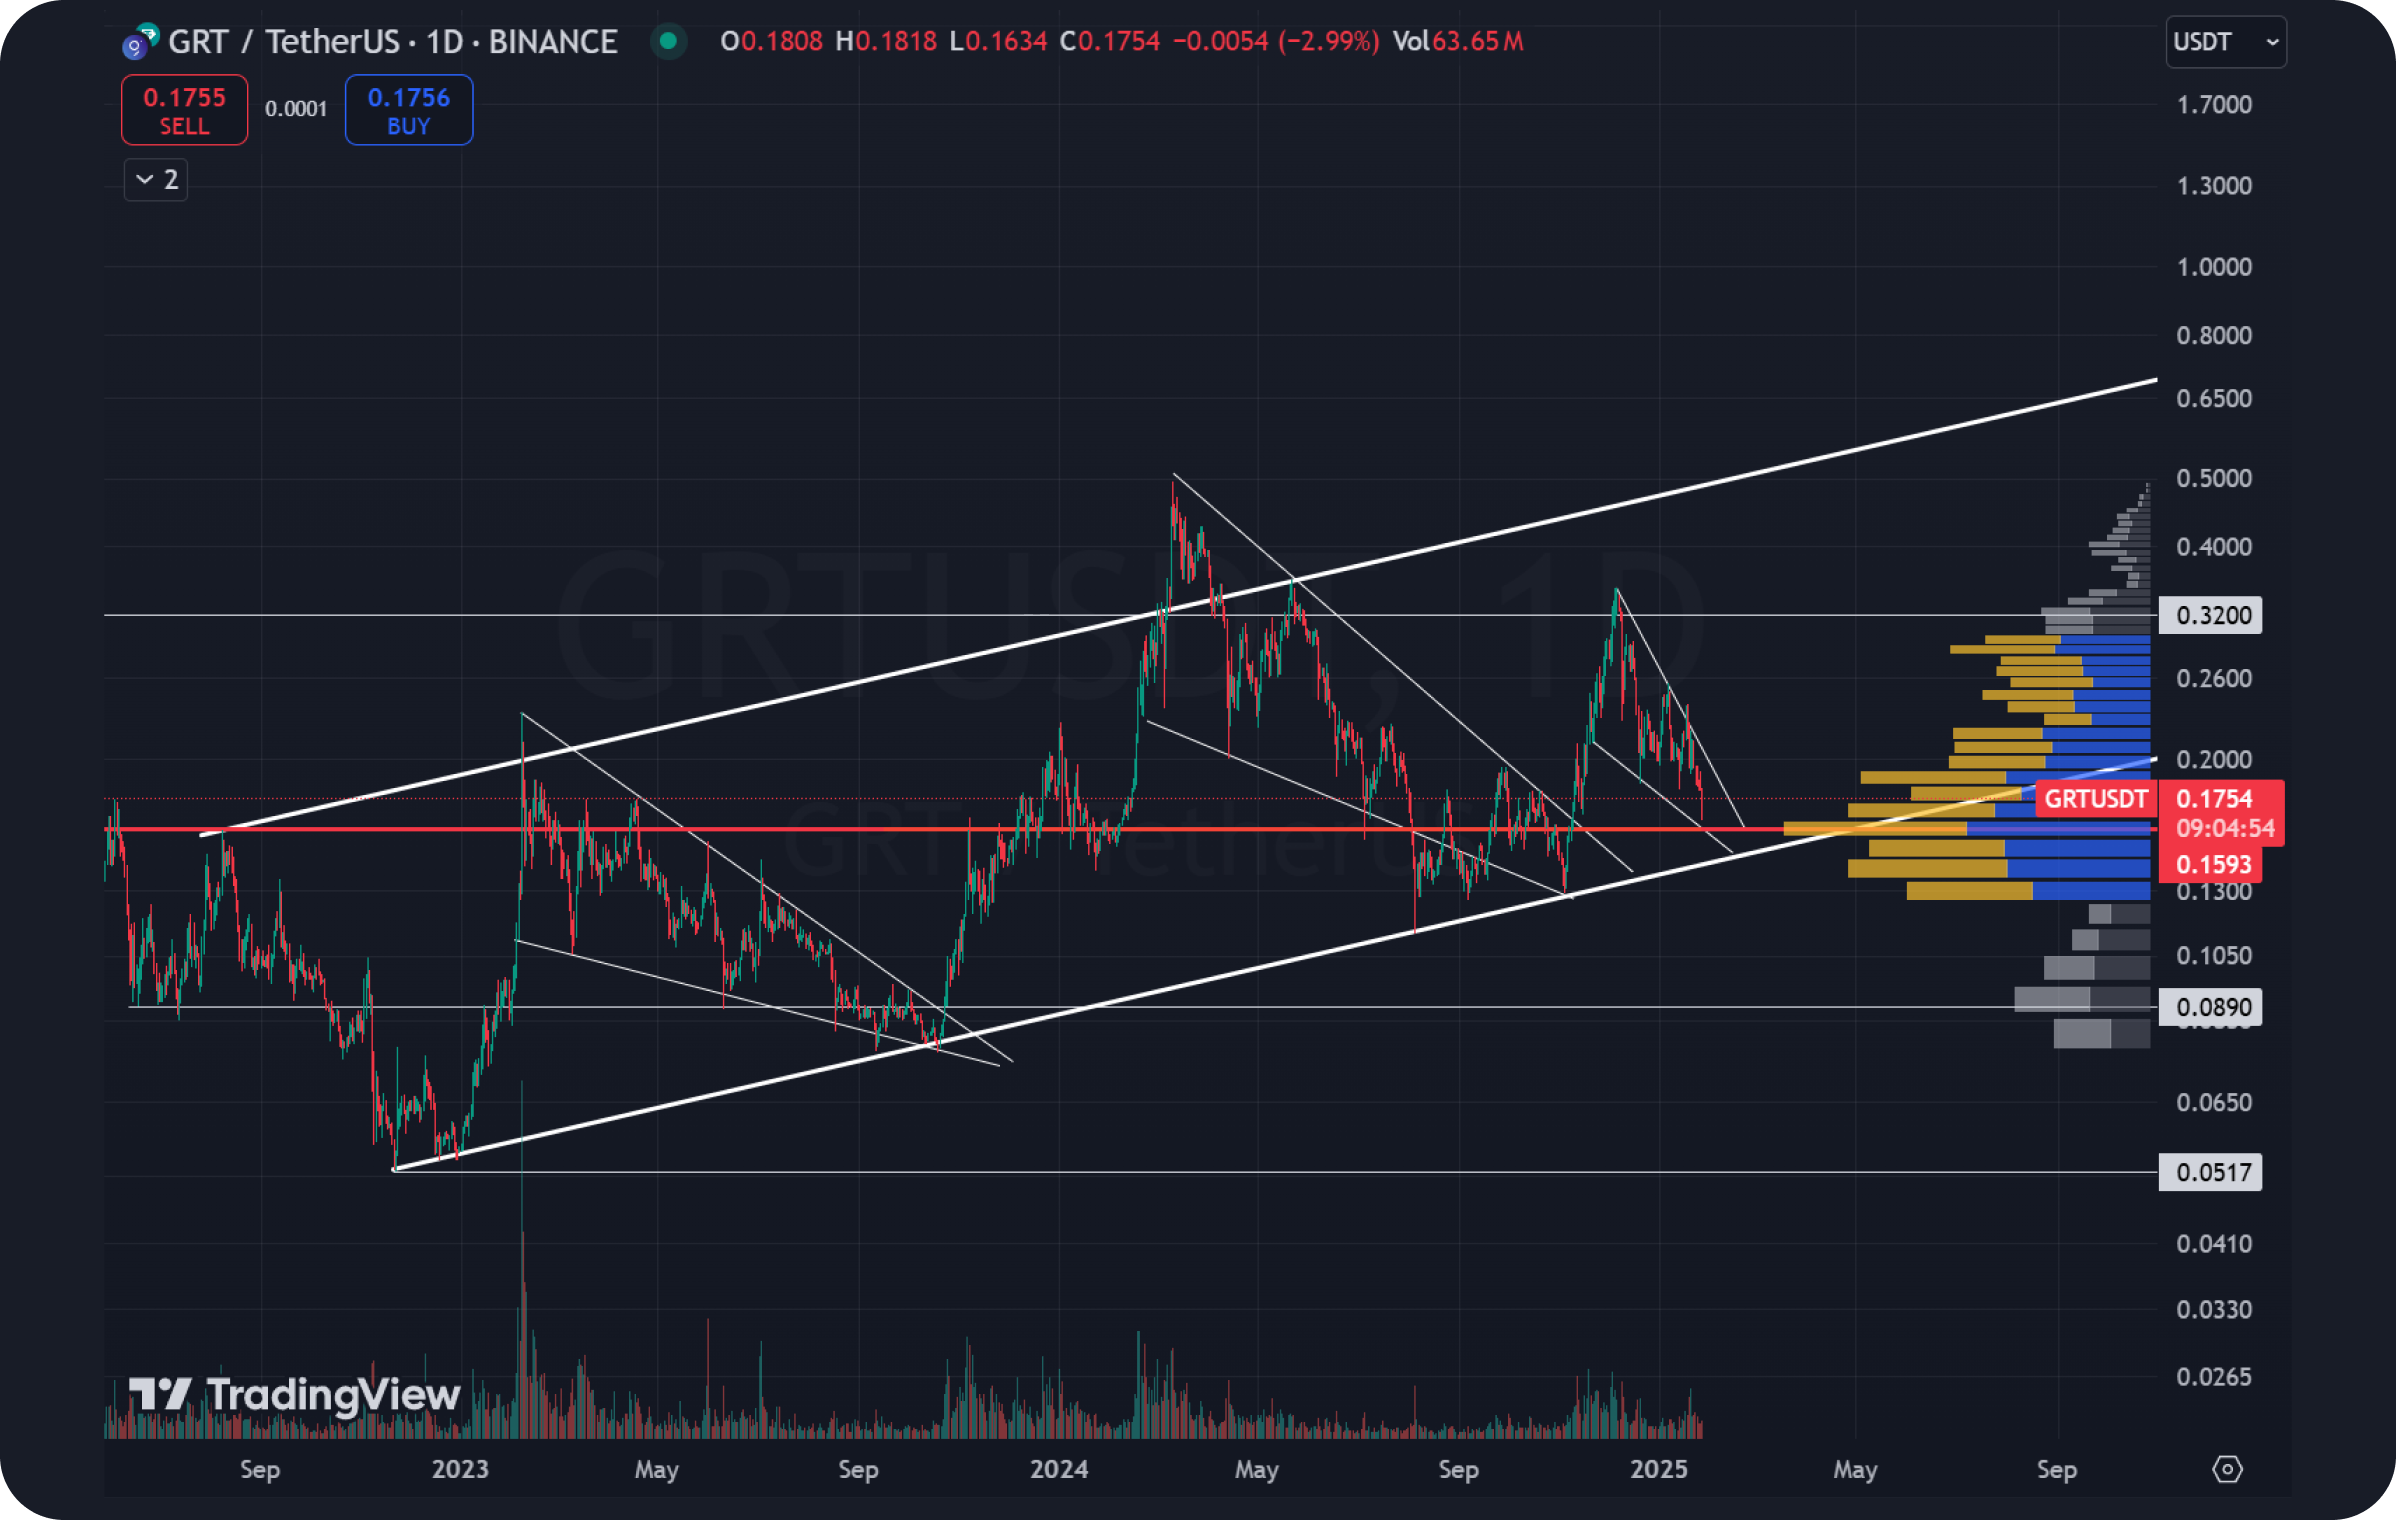
After reaching its all-time low, the asset transitioned into a gradual recovery phase. At present, GRT is moving within an upward trend channel, forming a distinct "ascending sideways" pattern.
Over the past two years, there have been sharp impulsive movements, followed by prolonged corrections. Each of these corrective moves was accompanied by the formation of bullish wedges, which ultimately broke upward.
GRT Price Prediction
Currently, GRT is once again forming a bullish wedge, approaching the lower boundary of the ascending channel. This level coincides with the significant Point of Control (POC) support zone, an area of maximum trading volume, increasing the likelihood of buyer activity.
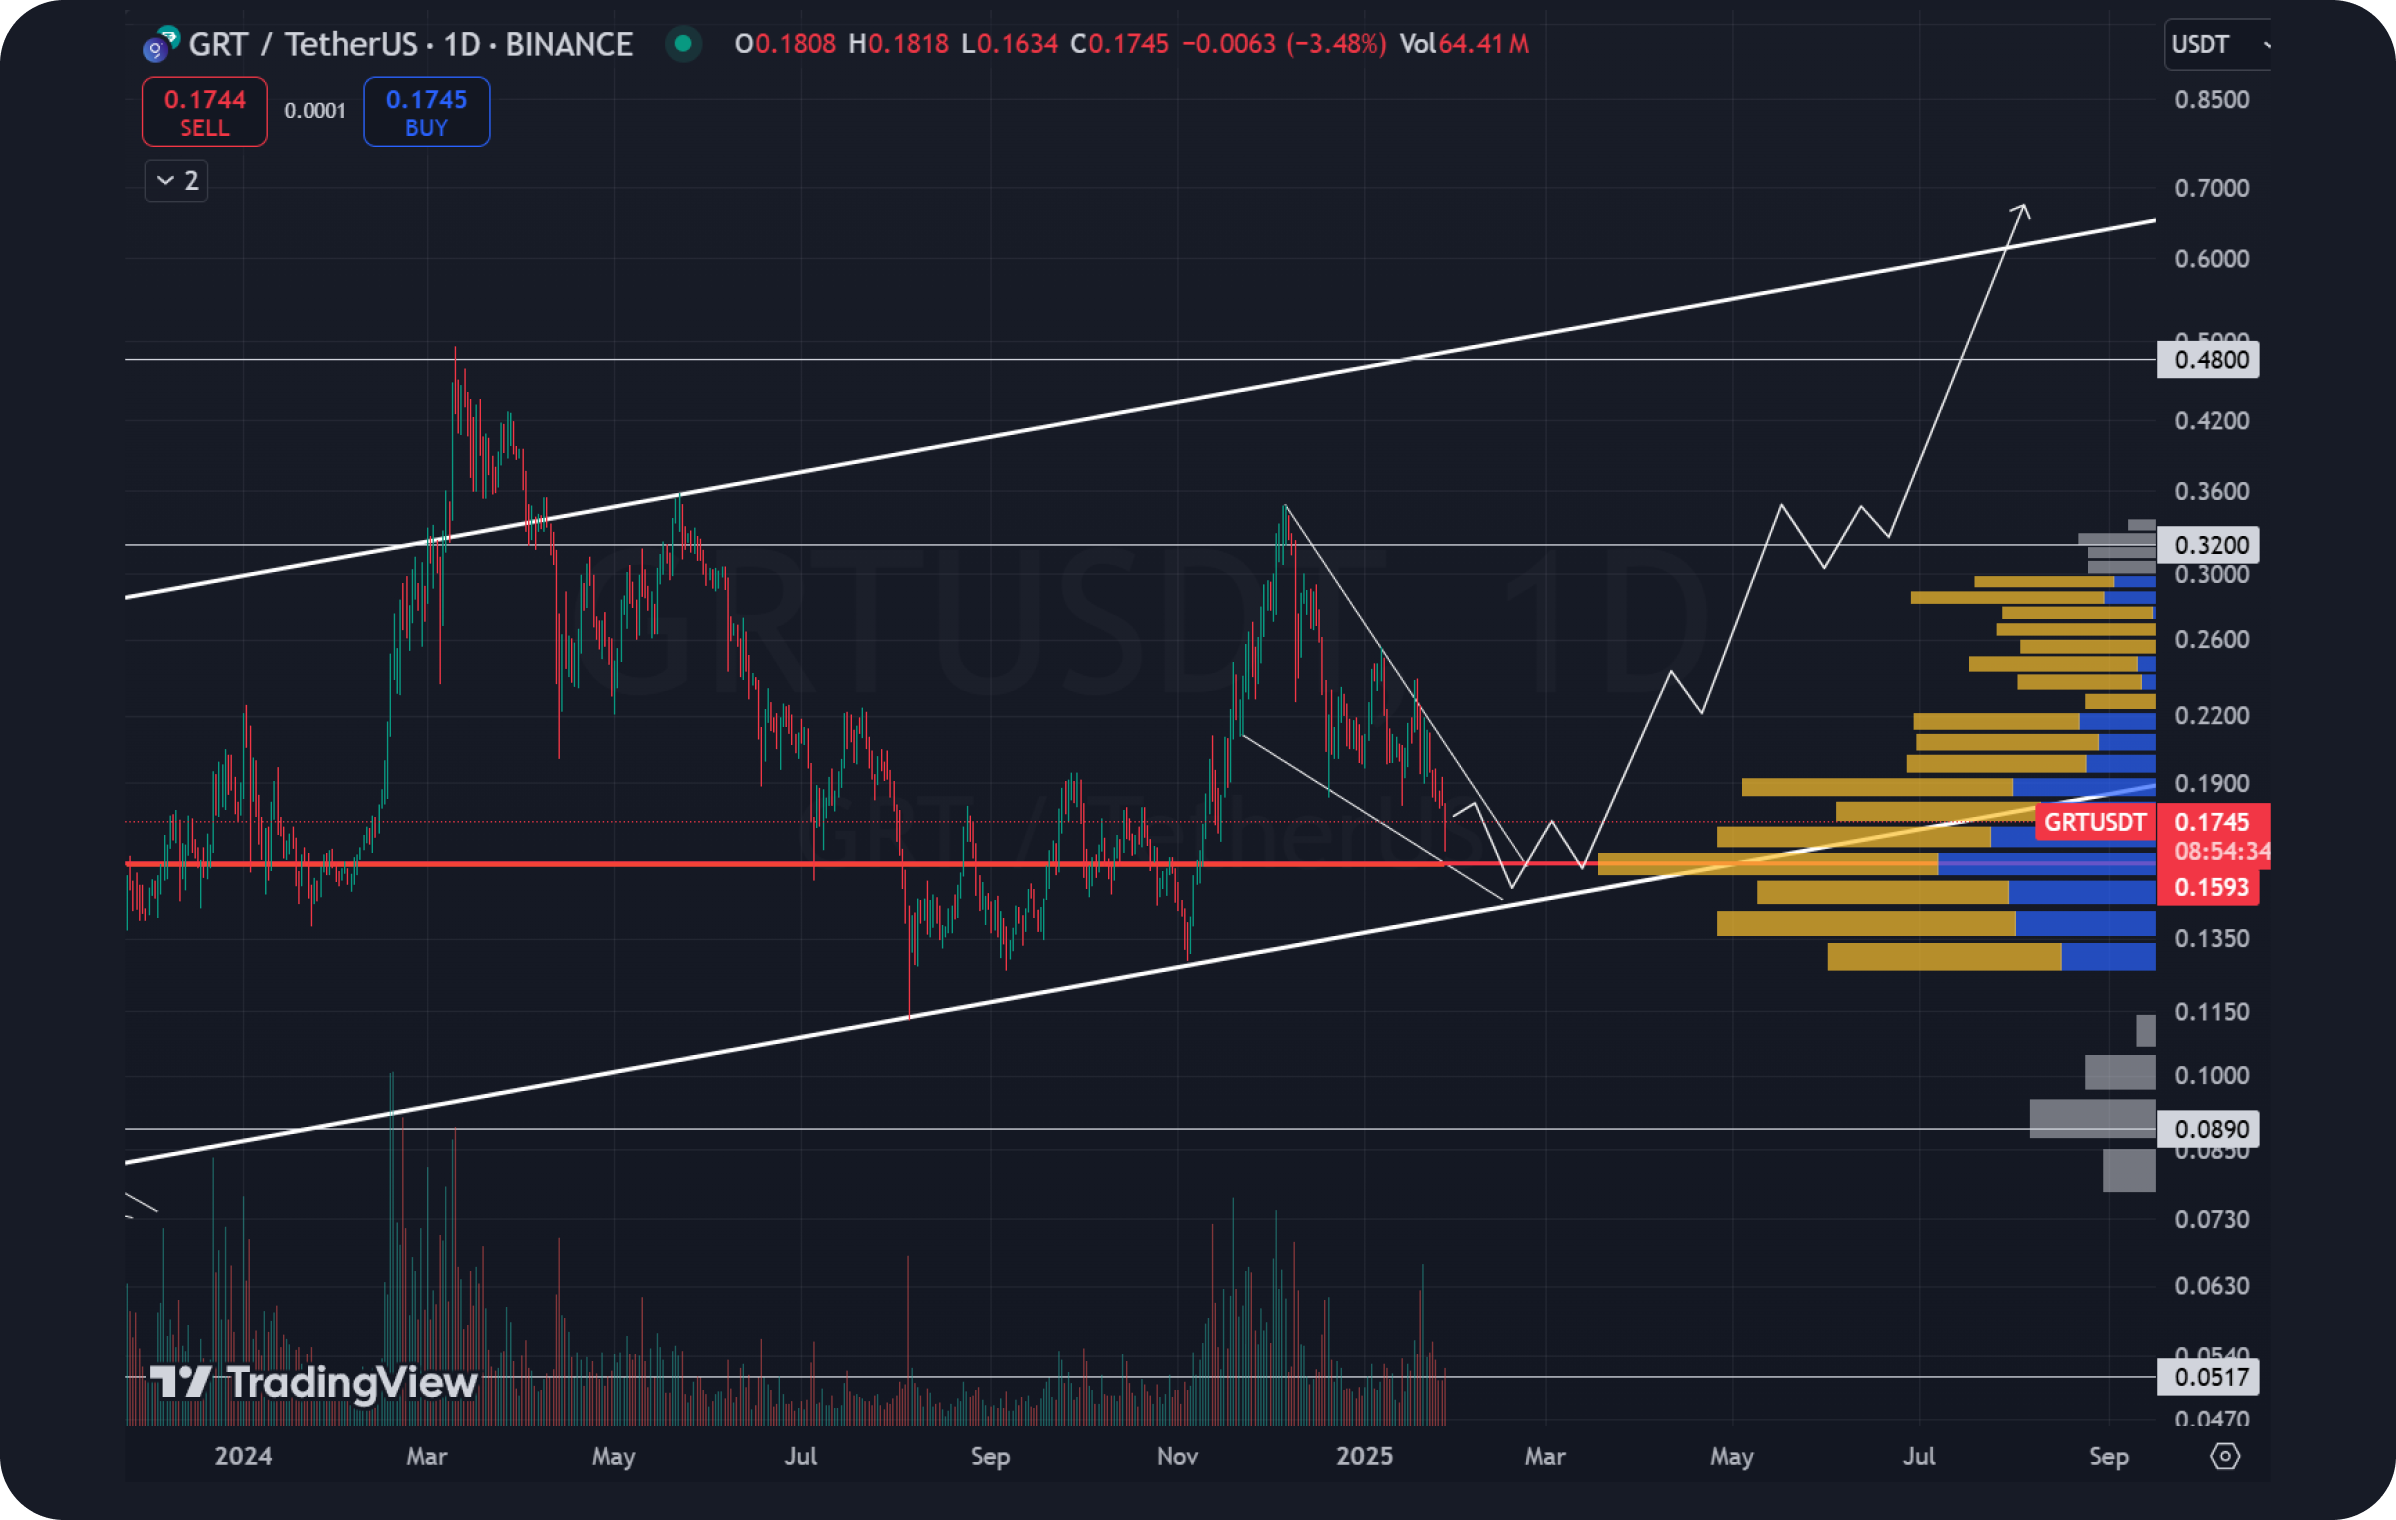
Considering the factors (bullish wedge, POC level, and proximity to the lower boundary of the trendline), it is reasonable to expect buyers to become more active soon, potentially driving a new impulsive growth. Strong resistance lies at $0.32. If this level is breached, the price may rise to $0.48, and then to the upper boundary of the ascending channel. If the trendline is broken to the upside, the growth could accelerate and transition into a steeper upward trend.
For those interested in the fundamentals of The Graph, its ecosystem, and current achievements, be sure to read our detailed protocol overview.
Users can get GRT or any other desired cryptocurrency for fiat or crypto on SimpleSwap.
The information in this article is not a piece of financial advice or any other advice of any kind. The reader should be aware of the risks involved in trading cryptocurrencies and make their own informed decisions. SimpleSwap is not responsible for any losses incurred due to such risks. For details, please see our Terms of Service.


