TIA Technical Analysis

Key Insights
- The cryptocurrency demonstrated exceptional early momentum, achieving a remarkable 1000%+ growth within its first quarter of trading after launching in late 2023, though this was followed by a significant market correction of over 80% from its peak.
- TIA has established a clear accumulation pattern with defined boundaries, featuring a crucial volume point of control (POC) in the mid-range.
- The asset's current positioning near the $6.20 mark represents a critical juncture, with potential for a new upward movement if it maintains above the accumulation zone's upper boundary.
TIA Tech Analysis
Celestia began trading at the end of October 2023 and immediately showed a pronounced upward trend. The initial growth momentum was extremely strong, allowing the asset to grow by more than 1000% in just three months. The maximum value (ATH) was recorded at $21.14.
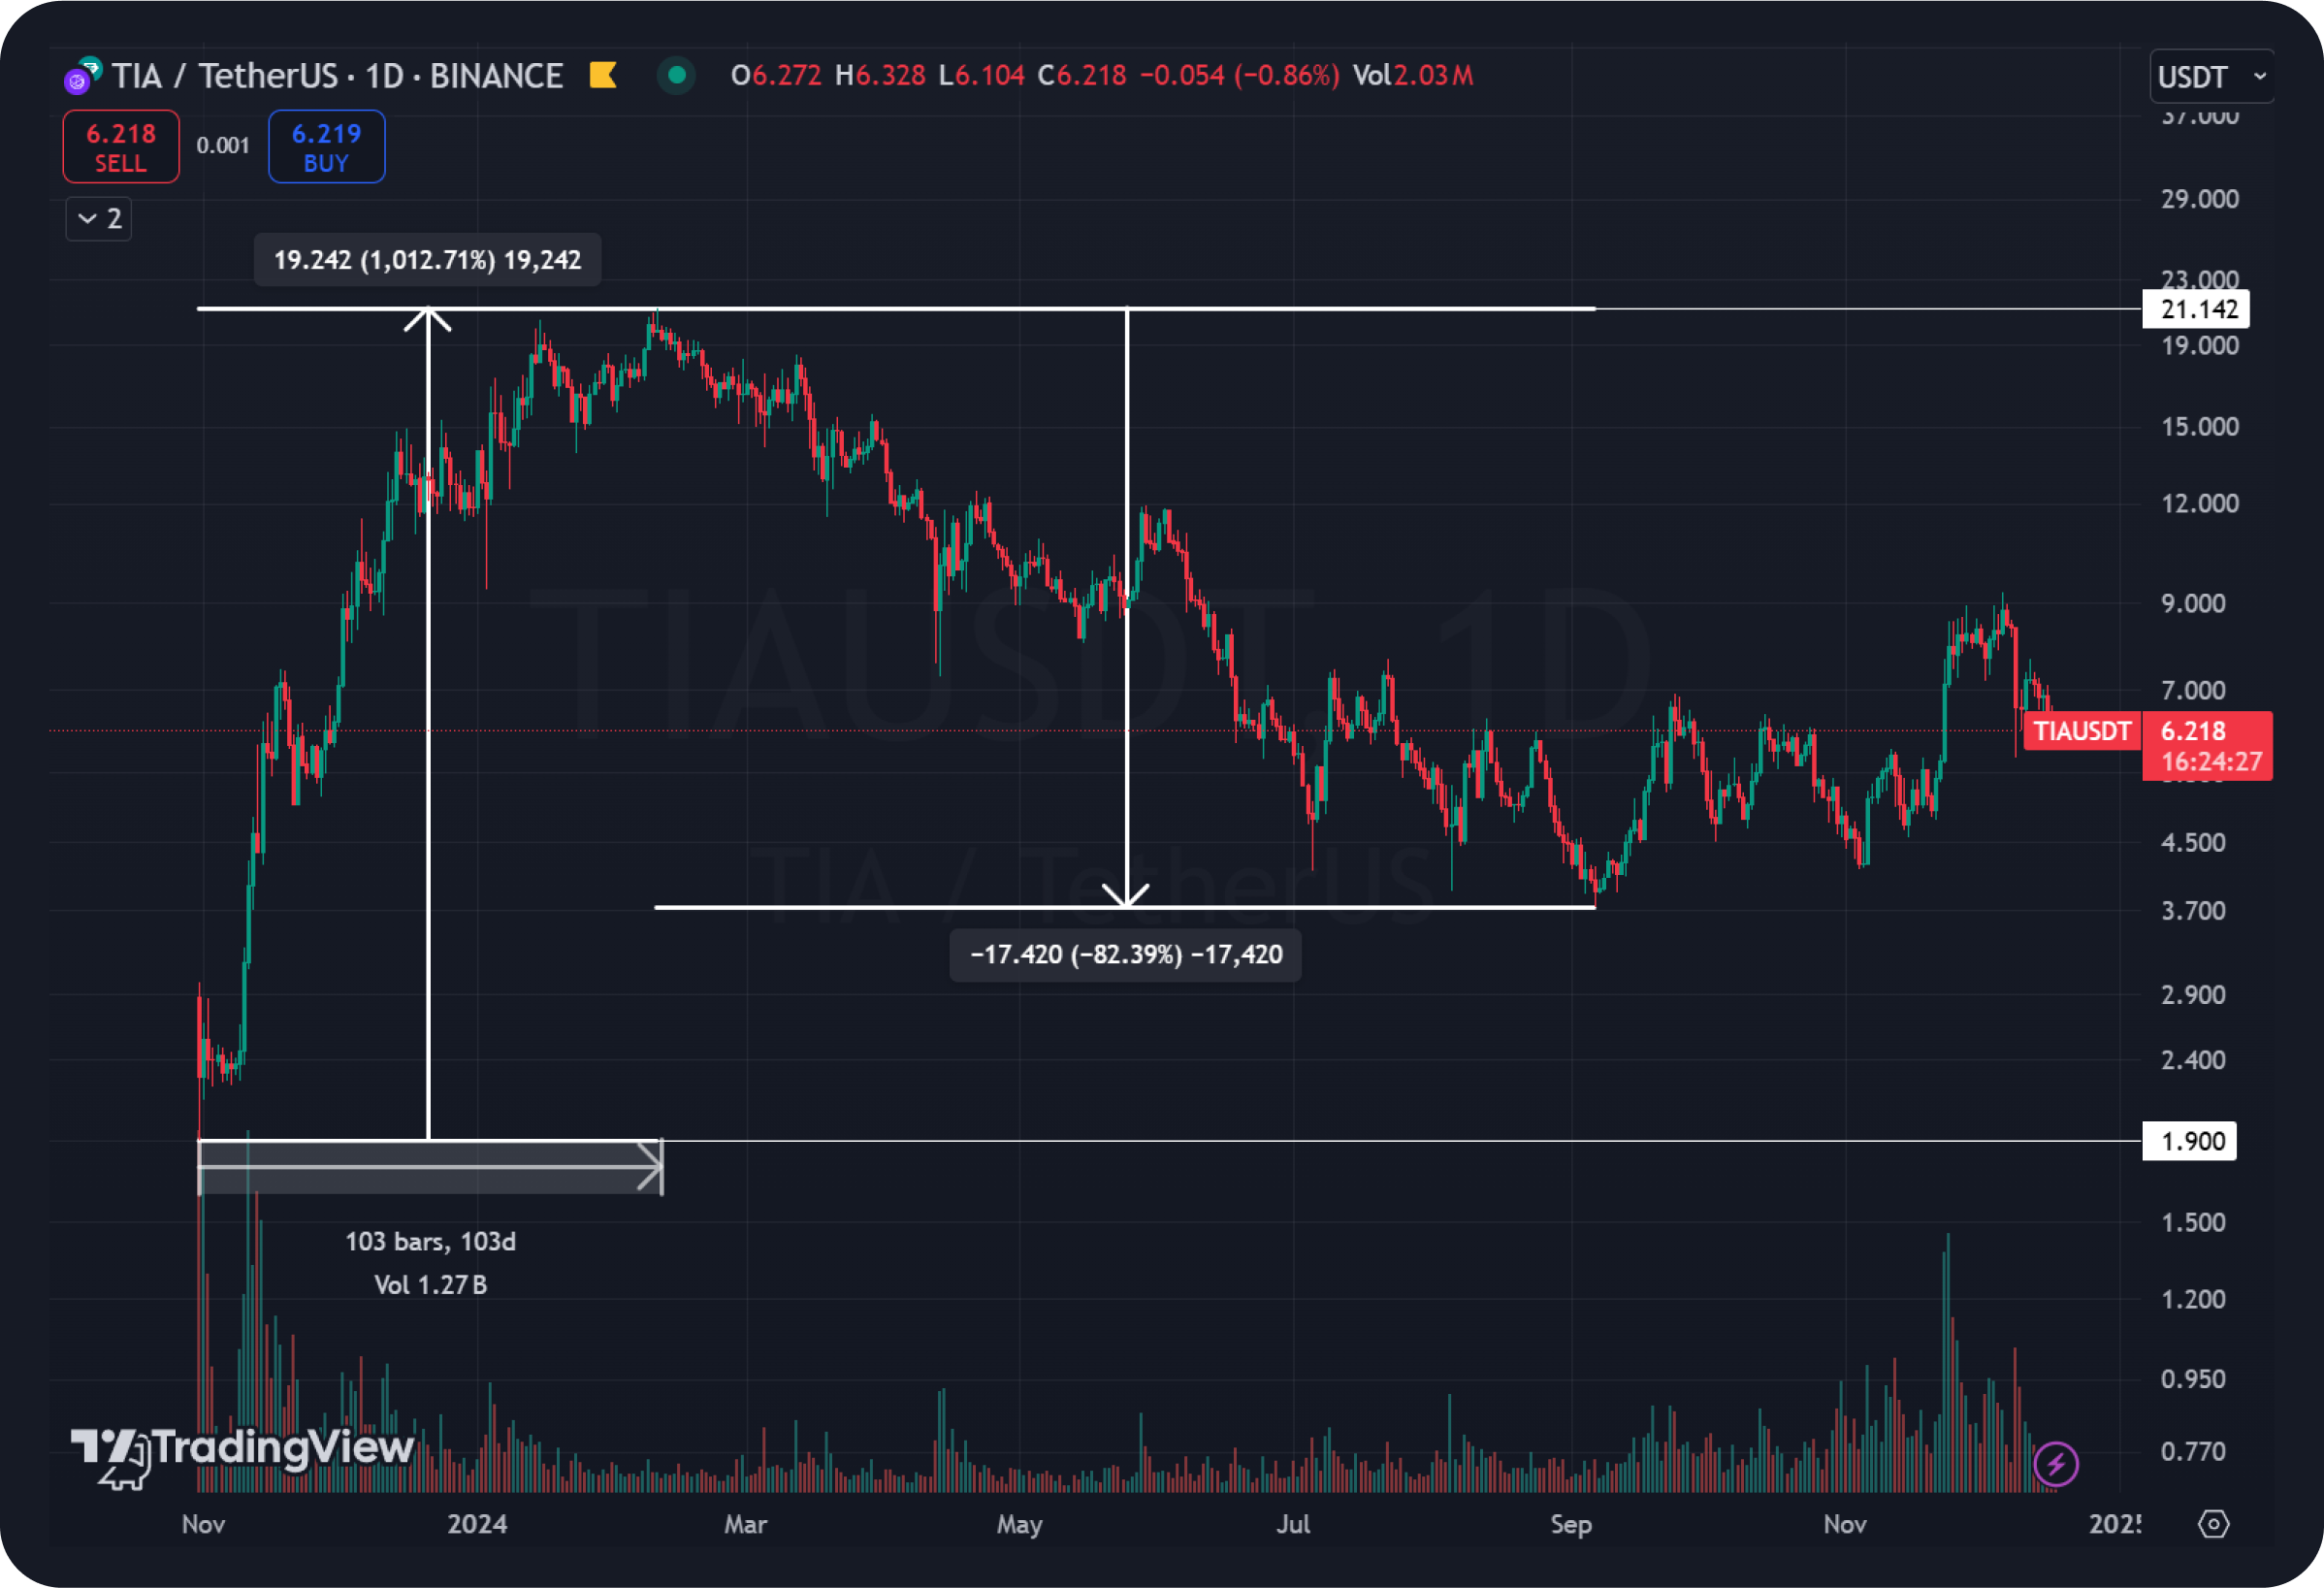
After the active growth phase was over, a deep correction followed. The total decline amounted to more than 82% of the maximum levels. The price fell to $3.72, where the asset appears to have formed the bottom of the correction. However, the first key support, from which the asset started the consolidation phase, is at $4.14.
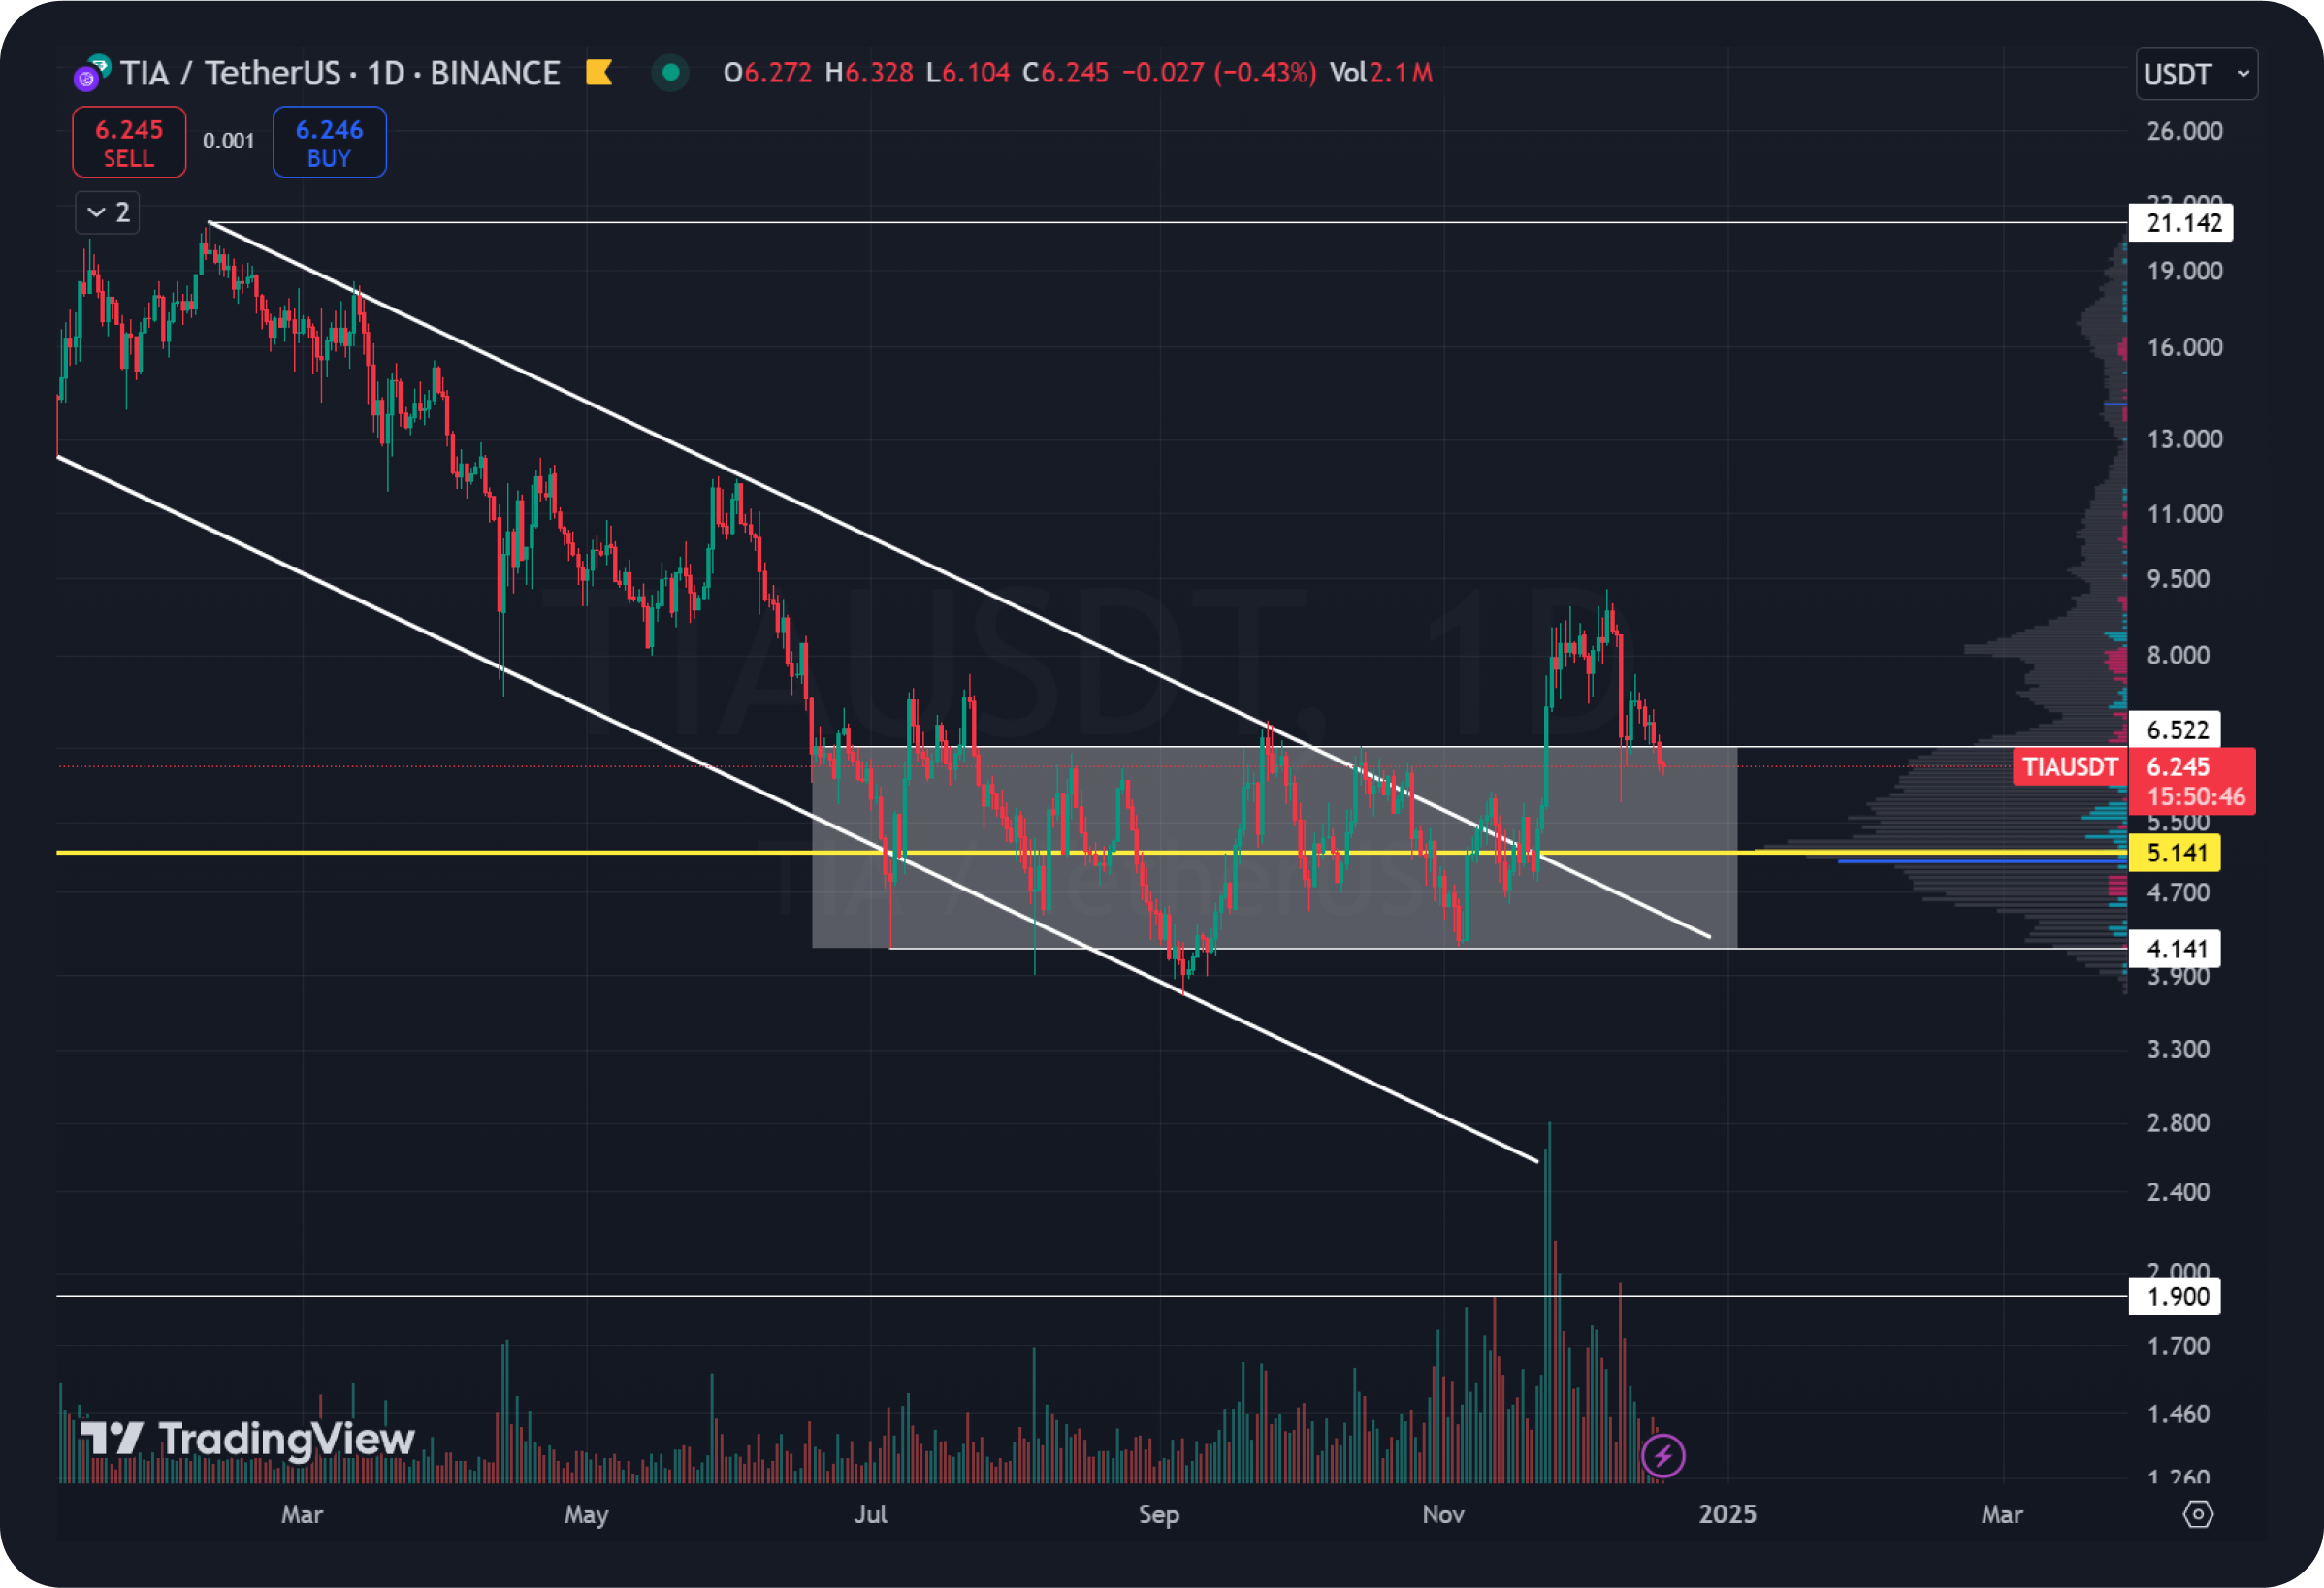
After reaching the support level of $4.14, TIA moved into the accumulation stage with the lower boundary at $4.14 and the upper boundary at $6.52. An important volume level (POC) is located in the middle of the accumulation range, at $5.14, which could act as a strong support if the price returns to these values.
During the consolidation, there were false breakdowns of both the upper and lower boundaries of the range, which resulted in liquidity capture on both sides and further confirmed the accumulation zone.
At the stage of decline the price was moving within the descending trend channel. Breakdown of the upper border of this channel led to impulse growth and exit from the accumulation zone. The exit occurred on increased volumes, which confirms the veracity of the breakdown, the local high was set at $9.36. However, buyers have not yet managed to continue the uptrend.
TIA Price Prediction
Now the TIA price returned to the upper boundary of the accumulation zone. The current price near the $6.20 level confirms the possibility of support retest and may become a key point for the formation of a new impulse.

Local correction of the price after the exit from the accumulation zone and breakdown of the descending channel, as well as trading near significant levels of the volume profile, can serve as a potential reversal zone and the beginning of a new upward movement.
In case buyers activate and the price returns above $6.52 level, we can expect the upward momentum to continue with the nearest targets at $8.52 and $11.88. These levels represent important resistances, and their overcoming may give an impulse for further growth.
Users can get TIA or any other cryptocurrency ojr fiat or crypto on SimpleSwap.
The information in this article is not a piece of financial advice or any other advice of any kind. The reader should be aware of the risks involved in trading cryptocurrencies and make their own informed decisions. SimpleSwap is not responsible for any losses incurred due to such risks. For details, please see our Terms of Service.


